. 2014 Jun 3;111(22):E2301-9.
doi: 10.1073/pnas.1400849111. Epub 2014 May 19.

Inferring fitness landscapes by regression produces biased estimates of epistasis

Affiliations

Inferring fitness landscapes by regression produces biased estimates of epistasis

Jakub Otwinowski et al. Proc Natl Acad Sci U S A. .

Abstract

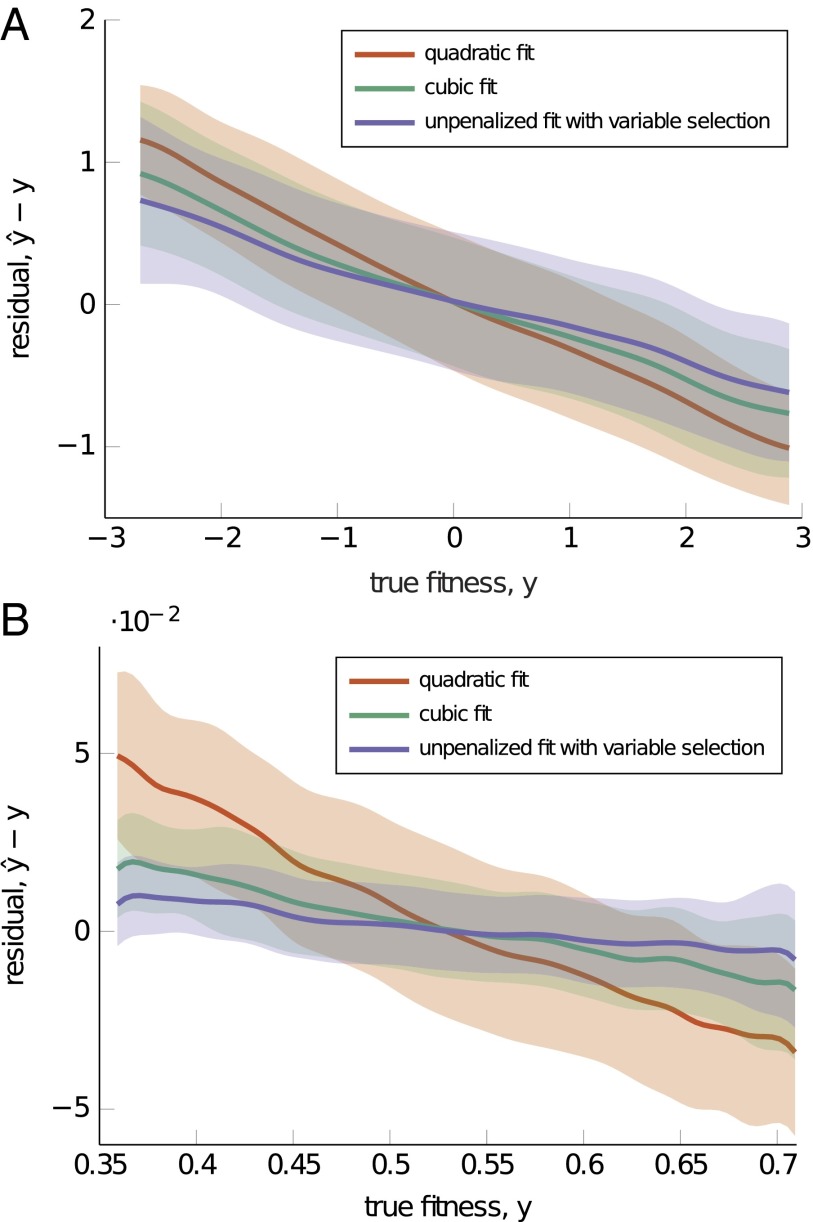
The genotype-fitness map plays a fundamental role in shaping the dynamics of evolution. However, it is difficult to directly measure a fitness landscape in practice, because the number of possible genotypes is astronomical. One approach is to sample as many genotypes as possible, measure their fitnesses, and fit a statistical model of the landscape that includes additive and pairwise interactive effects between loci. Here, we elucidate the pitfalls of using such regressions by studying artificial but mathematically convenient fitness landscapes. We identify two sources of bias inherent in these regression procedures, each of which tends to underestimate high fitnesses and overestimate low fitnesses. We characterize these biases for random sampling of genotypes as well as samples drawn from a population under selection in the Wright-Fisher model of evolutionary dynamics. We show that common measures of epistasis, such as the number of monotonically increasing paths between ancestral and derived genotypes, the prevalence of sign epistasis, and the number of local fitness maxima, are distorted in the inferred landscape. As a result, the inferred landscape will provide systematically biased predictions for the dynamics of adaptation. We identify the same biases in a computational RNA-folding landscape as well as regulatory sequence binding data treated with the same fitting procedure. Finally, we present a method to ameliorate these biases in some cases.

Keywords: experimental evolution; molecular evolution; penalized regression.


Conflict of interest statement

The authors declare no conflict of interest.

Figures

Fig. 1.
Fig. 1.
Fitness-dependent bias caused by penalized regression. Penalized regression tends to reduce the magnitude of inferred coefficients, which biases the estimated fitness, y^, to the average value. Therefore, the high fitnesses are underestimated and the low fitnesses are overestimated. The plot shows the mean (solid lines) and SD (shaded areas) of the distribution of residuals at a given true fitness value y, smoothed by a Gaussian moving window (Materials and Methods). The fewer the observations (i.e., the smaller the number of genotypes sampled for fitting the statistical model), the stronger the effect of this bias, which was seen by comparing fits with training datasets of different sizes: 250 sampled genotypes (red), 200 sampled genotypes (green), and 150 sampled genotypes (blue). Genotypes were sampled randomly from a quadratic polynomial fitness landscape, which lacks any three-way interactions (parameters v1=2/3, v2=1/3, v3=0, σy2=1, and L=20 sites) (Materials and Methods). The training data were fit to a quadratic model, which has p=211 parameters, and therefore the statistical model is well-specified. A test set of 5,000 random genotypes was used to compare the predicted (y^) and true (y) fitnesses of genotypes. With sufficient sampled data no penalization is required and the resulting statistical fit contains no bias (red).
Fig. 2.
Fig. 2.
Fitness-dependent bias caused by model misspecification. A misspecified statistical model of the fitness landscape tends to bias predicted fitnesses to the mean fitness, resulting in underestimated high-fitness genotypes and overestimated low-fitness genotypes. The figure is based on quadratic fits (p=211 parameters) to 5,000 randomly sampled individuals from three different cubic polynomial landscapes each with L=20 sites and σy2=1: red, v1=1/3, v2=1/3, and v3=0; green, v1=0.6, v2=0.3, and v3=0.1; and blue, v1=1/3, v2=1/6, and v3=1/2. The larger the value of v3, the greater the amount of model misspecification and the stronger the bias. A test set of 5,000 random genotypes was used to compare the predicted (y^) and true (y) fitnesses of individuals.
Fig. 3.
Fig. 3.
Fitness-dependent bias caused by both model misspecification and penalized regression for genotypes sampled from a WF population under selection. The predicted fitnesses (y^) were computed from cross-validated training data (red), for genotypes sampled one mutation away from the training data (purple), and for genotypes sampled two mutations away from the training data (cyan). The true fitnesses (y) are determined by a cubic polynomial fitness landscape on L=20 sites with v1=0.6, v2=0.3, v3=0.1, and σy2=0.05. Genotypes for fitting the quadratic statistical model were sampled from the population after 100 generations of WF evolution, with mutation rate U=103 and population size N=106 (Materials and Methods).
Fig. 4.
Fig. 4.
Predictive power as measured by squared correlation coefficients between true and inferred fitnesses, for 500 regressions trained on samples from a WF population under selection. Cross-validated squared correlation coefficients from the training data (red) indicate that the fit obtained from sampling a population under selection can be more accurate than expected from a regression on randomly sampled genotypes (dashed line). Predictive power for fitnesses of unsampled genotypes is quantified by the squared correlation coefficients between model predictions (y^) and true fitnesses (y) for sequences that are one mutation away from the training data (purple), two mutations away from the training data (cyan), and random sequences (black). Genotypes used as training data were sampled from a WF population after 100 generations of evolution with mutation rates U=103 and population size N=106 (Materials and Methods). Landscapes were instances of a cubic polynomial form, with v3 values ranging from 0 to 1 (x axis), v2 drawn uniformly in range {0,1v3}, and v1=1v3v2. The number of unique sequences sampled from each WF population varied from 34 to 603 (not shown).
Fig. 5.
Fig. 5.
Bias in the inferred fitness landscape results in bias in a standard measure of epistasis: the proportion of accessible paths (paths that are monotonically increasing in fitness between an ancestral and an adapted genotype). (A) All possible mutational paths between a low- and a high-fitness genotype separated by five mutations under the true (black) and inferred (red) fitness landscape. The bias to the mean in the inferred landscape tends to reduce the number of fitness valleys and thereby, increases the number of paths accessible to evolution. (B) This bias in the apparent proportion of accessible paths occurs generally across many independent draws of the true underlying fitness landscape. For each landscape, we simulated populations that began monomorphic for a low-fitness genotype and then evolved for 100 generations under selection (Materials and Methods). The resulting most-frequent genotype was used as the derived genotype, and the final population was used to fit a quadratic model of the fitness landscape. All mutational paths between ancestral and derived genotypes were evaluated, provided that the two genotypes differed by five to seven substitutions. The graph compares the fraction of accessible paths for the true (x axis) and inferred (y axis) landscapes. The inferred landscapes tend to overestimate the proportion of accessible paths compared with the true landscape: the proportion of accessible paths was overestimated 3.9 times more often than it was underestimated. In all cases, the true landscape was cubic polynomial with v1=1/3, v2=1/6, v3=1/2, and σy2=0.01. WF simulation parameters are U=103 and N=106 with 500 generated landscapes and simulations.
Fig. 6.
Fig. 6.
Bias arising in a quadratic fit to (A) computational RNA-folding landscape (Materials and Methods) and (B) regulatory sequence binding landscape from the works by Kinney et al. (52) and Otwinowski and Nemenman (65) (Materials and Methods). The data are discrete in true fitnesses, y. Circles indicate means of distributions of residuals within each bin, and error bars indicate SDs. The quadratic fit exhibits the same type of bias to the mean fitness as observed in NK and polynomial fitness landscapes.
Fig. 7.
Fig. 7.
Reducing bias when fitting a statistical model to (A) cubic polynomial landscape and (B) NK landscape. Bias in the inferred fitnesses can be reduced by adding third-order interactions to the statistical model (quadratic fit in red compared with cubic fit in green). Although the green model is correctly specified, some bias still remains because of the penalized regression (p=1,351 parameters fit with Ntrain=800 data points). Additional reduction of bias can be achieved by selecting model variables with LASSO (60, 77) and then performing an unpenalized regression only with the selected variables (blue). The variable selection step may omit some important variables, especially when the true landscapes include a large number of higher-order interactions, such as in the cubic polynomial case (A). If the true landscape has a sparse set of interactions [e.g., the NK landscape (B)], then bias can be removed almost entirely by this two-step procedure. (A) Cubic polynomial landscape with v1=1/3, v2=1/6, and v3=1/2. (B) NK landscape with K=2. A test set of 5,000 random genotypes was used to compare the predicted (y^) and true (y) fitnesses.

Similar articles

Cited by

References

    1. Lenski RE, Rose MR, Simpson SC, Tadler SC. Long-term experimental evolution in Escherichia coli. I. Adaptation and divergence during 2,000 generations. Am Nat. 1991;138(6):1315.
    1. Lenski RE, Travisano M. Dynamics of adaptation and diversification: A 10,000-generation experiment with bacterial populations. Proc Natl Acad Sci USA. 1994;91(15):6808–6814. - PMC - PubMed
    1. Elena SF, Lenski RE. Evolution experiments with microorganisms: The dynamics and genetic bases of adaptation. Nat Rev Genet. 2003;4(6):457–469. - PubMed
    1. Blount ZD, Borland CZ, Lenski RE. Historical contingency and the evolution of a key innovation in an experimental population of Escherichia coli. Proc Natl Acad Sci USA. 2008;105(23):7899–7906. - PMC - PubMed
    1. Woods RJ, et al. Second-order selection for evolvability in a large Escherichia coli population. Science. 2011;331(6023):1433–1436. - PMC - PubMed

Publication types

LinkOut - more resources