. 2014 Jun 3;111(22):E2329-38.
doi: 10.1073/pnas.1319284111. Epub 2014 May 19.

Relating the metatranscriptome and metagenome of the human gut

Affiliations

Relating the metatranscriptome and metagenome of the human gut

Eric A Franzosa et al. Proc Natl Acad Sci U S A. .

Abstract

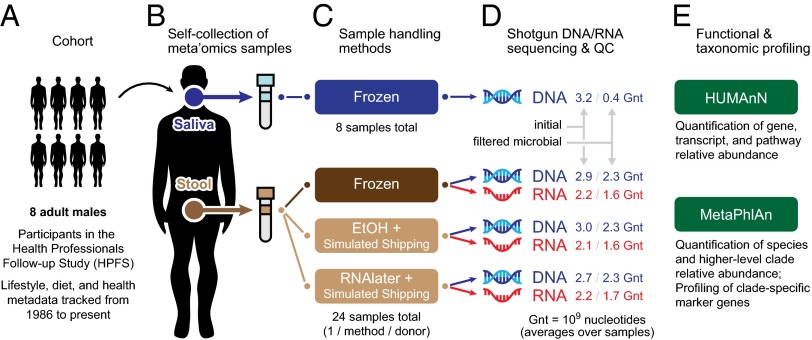
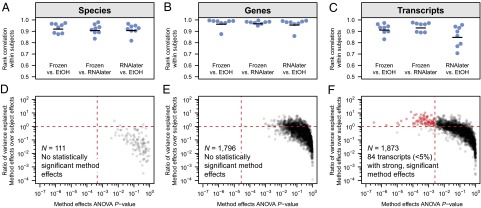
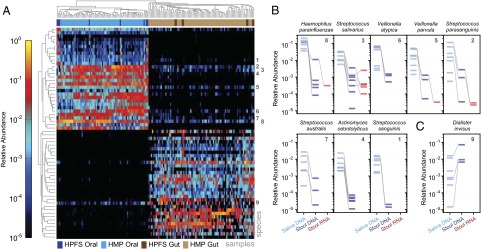
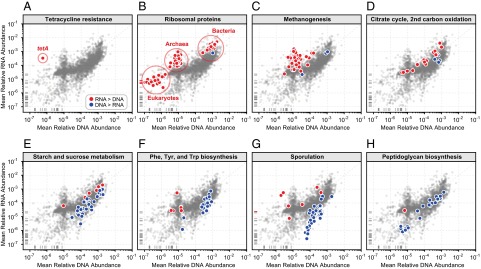
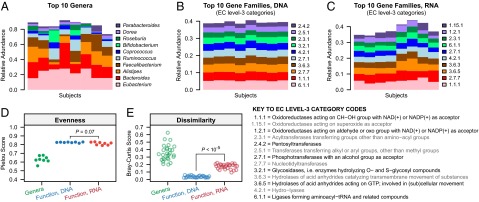
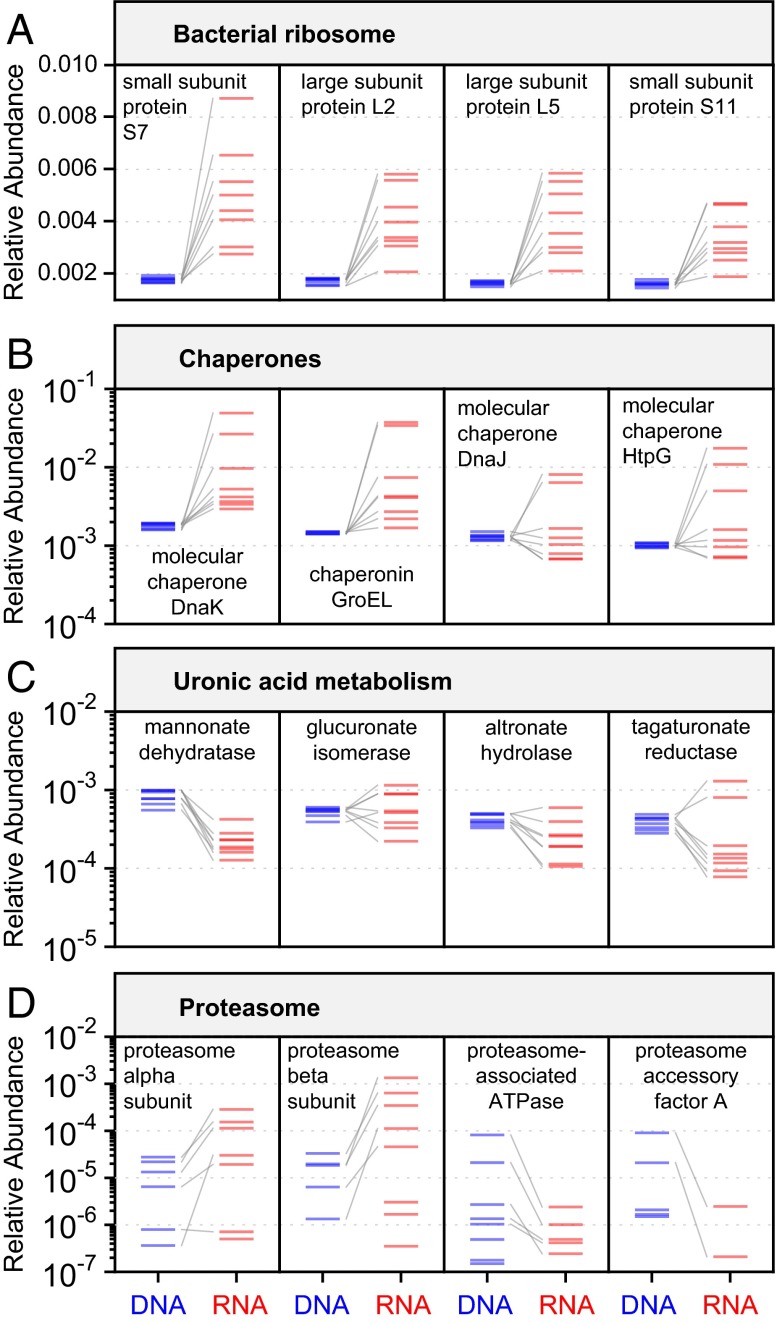
Although the composition of the human microbiome is now well-studied, the microbiota's >8 million genes and their regulation remain largely uncharacterized. This knowledge gap is in part because of the difficulty of acquiring large numbers of samples amenable to functional studies of the microbiota. We conducted what is, to our knowledge, one of the first human microbiome studies in a well-phenotyped prospective cohort incorporating taxonomic, metagenomic, and metatranscriptomic profiling at multiple body sites using self-collected samples. Stool and saliva were provided by eight healthy subjects, with the former preserved by three different methods (freezing, ethanol, and RNAlater) to validate self-collection. Within-subject microbial species, gene, and transcript abundances were highly concordant across sampling methods, with only a small fraction of transcripts (<5%) displaying between-method variation. Next, we investigated relationships between the oral and gut microbial communities, identifying a subset of abundant oral microbes that routinely survive transit to the gut, but with minimal transcriptional activity there. Finally, systematic comparison of the gut metagenome and metatranscriptome revealed that a substantial fraction (41%) of microbial transcripts were not differentially regulated relative to their genomic abundances. Of the remainder, consistently underexpressed pathways included sporulation and amino acid biosynthesis, whereas up-regulated pathways included ribosome biogenesis and methanogenesis. Across subjects, metatranscriptional profiles were significantly more individualized than DNA-level functional profiles, but less variable than microbial composition, indicative of subject-specific whole-community regulation. The results thus detail relationships between community genomic potential and gene expression in the gut, and establish the feasibility of metatranscriptomic investigations in subject-collected and shipped samples.


Conflict of interest statement

The authors declare no conflict of interest.

Figures

Fig. 1.
Fig. 1.
A self-sampling method compatible with metagenomic and metatranscriptomic sequencing of the human microbiome. (A) Eight participants from the HPFS cohort were recruited to assess the viability of self-collection methods in meta’omics studies and to simultaneously investigate relationships between the human oral metagenome, gut metagenome, and gut metatranscriptome. (B) Subjects self-collected samples of saliva and stool, which were returned to the laboratory. (C) Saliva samples were frozen and stool samples were tested under three conditions, including simulated shipping conditions: (i) frozen control, (ii) fixed in ethanol, and (iii) fixed in RNAlater. (D) DNA was extracted from all saliva and stool samples; RNA was extracted from stool samples only and reverse-transcribed to cDNA. All samples were then sequenced using the Illumina HiSeq platform. Raw sequence data were filtered to remove low quality and human host reads. (E) Metagenomic and metatranscriptomic read data were profiled for functional and taxonomic composition using HUMAnN (17) and MetaPhlAn (16), respectively.
Fig. 2.
Fig. 2.
Taxonomic and functional profiles are consistent across sample handling methods. Global profiles of (A) species composition, (B) gene-level functional composition, and (C) transcript-level functional composition were highly concordant in within-subject comparisons of frozen controls vs. mock-shipped samples (Spearman’s rank correlation coefficient); black bars represent the averages across each group of eight correlation coefficients. Sample handling effect was further quantified by two-way ANOVA for all (D) species, (E) genes, and (F) transcripts detected with relative abundance of at least 10−4 (0.01%) in at least three samples. Following correction for multiple hypothesis testing, <5% of transcripts showed a strong, significant effect from choice of sample handling method; we observed no significant sample handling effects for either species or genes. Vertical red lines represent the threshold for statistical significance (Benjamini–Hochberg FDR, α = 0.05); features above the horizontal red lines have greater between-method variation than between-subject variation.
Fig. 3.
Fig. 3.
Oral-gut ecology in the HPFS and HMP cohorts. (A) We isolated species observed in the eight pairs of frozen stool and saliva samples from the HPFS cohort with relative abundance of at least 10−2 (1%) in two HPFS samples. The taxonomic profiles of these species were compared with stool and tongue samples from the HMP cohort, with tongue representing the oral community. Samples were clustered by Bray–Curtis distance, and species were clustered by rank correlation. Note that samples cluster strongly by body site (oral vs. gut). Highly abundant oral species are more likely to be detected at low levels in the gut. Green numbers associate oral-gut co-occurring species with detailed abundance profiles in B and C. (B) Eight abundant oral species detected in the HPFS saliva samples were detectable at low abundance in the stool samples from the same individuals, but showed minimal transcriptional activity in the stool. Gray lines connect oral DNA (light blue), gut DNA (dark blue), and gut RNA (red) from the same individual. (C) D. invisus is an unusual example of a gut-dominant species that also occurs in the oral cavity.
Fig. 4.
Fig. 4.
Up- and down-regulated pathways and clades in the gut metatranscriptome. Gene and transcript relative abundances are generally well correlated (Spearman’s r = 0.76). (A–H) Each scatterplot illustrates the average gene (DNA) and transcript (RNA) relative abundance for 3,292 KOs from the eight frozen HPFS stool samples, highlighting a prominent over- or underexpressed functional module. Red circles correspond to KOs where RNA > DNA; blue circles correspond to KOs where DNA > RNA. Marks on the x or y axis margins represent KOs with zero measured abundance in one dataset but nonzero abundance in the other. The trends illustrated here were all of large effect (fold-change > 2) and statistically significant following FDR correction (Methods).
Fig. 5.
Fig. 5.
Functional diversity at the transcriptional level suggests a pattern of subject-specific metagenome regulation. (A) The 10 most abundant genera in each subject. (B) The 10 most abundant Enzyme Commission (EC) level-3 function categories in each individual, based on metagenomic measurements. (C) The 10 most abundant EC level-3 function categories in each individual, based on metatranscriptomic measurements. (D) Comparison of within-sample evenness for taxonomic and functional profiles across individuals using the Pielou metric. (E) Comparison of between-sample (β) diversity for taxonomic and functional profiles using the Bray–Curtis metric. Two-tailed P-values are based on the Wilcoxon signed-rank test. Although taxonomic profiles are highly variable among subjects, metagenomes are stable but differentially regulated at the transcriptional level.
Fig. 6.
Fig. 6.
A subset of individual functional groups that are metagenomically stable but differentially transcribed between individuals. (A–C) In each example, the four most DNA-abundant genes from a functional module with strong between-subject expression variation are highlighted. RNA (red) and DNA (blue) measurements from the same individual are connected by gray lines. (D) The proteasome is an example of a functional module whose variability at the RNA level can be attributed largely to variation at the DNA level, rather than differential expression.

Similar articles

Cited by

References

    1. Morgan XC, Huttenhower C. Chapter 12: Human microbiome analysis. PLOS Comput Biol. 2012;8(12):e1002808. - PMC - PubMed
    1. Maurice CF, Haiser HJ, Turnbaugh PJ. Xenobiotics shape the physiology and gene expression of the active human gut microbiome. Cell. 2013;152(1-2):39–50. - PMC - PubMed
    1. Smith MI, et al. Gut microbiomes of Malawian twin pairs discordant for kwashiorkor. Science. 2013;339(6119):548–554. - PMC - PubMed
    1. Gilbert JA, et al. Detection of large numbers of novel sequences in the metatranscriptomes of complex marine microbial communities. PLoS ONE. 2008;3(8):e3042. - PMC - PubMed
    1. Shi Y, Tyson GW, DeLong EF. Metatranscriptomics reveals unique microbial small RNAs in the ocean’s water column. Nature. 2009;459(7244):266–269. - PubMed

Publication types

Associated data