Hierarchical expression of genes controlled by the Bacillus subtilis global regulatory protein CodY
- PMID: 24843172
- PMCID: PMC4050614
- DOI: 10.1073/pnas.1321308111
Hierarchical expression of genes controlled by the Bacillus subtilis global regulatory protein CodY
Abstract
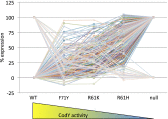
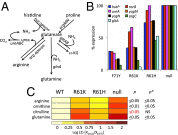
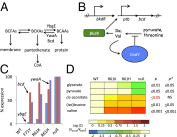
Global regulators that bind strategic metabolites allow bacteria to adapt rapidly to dynamic environments by coordinating the expression of many genes. We report an approach for determining gene regulation hierarchy using the regulon of the Bacillus subtilis global regulatory protein CodY as proof of principle. In theory, this approach can be used to measure the dynamics of any bacterial transcriptional regulatory network that is affected by interaction with a ligand. In B. subtilis, CodY controls dozens of genes, but the threshold activities of CodY required to regulate each gene are unknown. We hypothesized that targets of CodY are differentially regulated based on varying affinity for the protein's many binding sites. We used RNA sequencing to determine the transcription profiles of B. subtilis strains expressing mutant CodY proteins with different levels of residual activity. In parallel, we quantified intracellular metabolites connected to central metabolism. Strains producing CodY variants F71Y, R61K, and R61H retained varying degrees of partial activity relative to the WT protein, leading to gene-specific, differential alterations in transcript abundance for the 223 identified members of the CodY regulon. Using liquid chromatography coupled to MS, we detected significant increases in branched-chain amino acids and intermediates of arginine, proline, and glutamate metabolism, as well as decreases in pyruvate and glycerate as CodY activity decreased. We conclude that a spectrum of CodY activities leads to programmed regulation of gene expression and an apparent rerouting of carbon and nitrogen metabolism, suggesting that during changes in nutrient availability, CodY prioritizes the expression of specific pathways.
Keywords: BCAA; ILV; RNA-seq; metabolite analysis.
Conflict of interest statement
The authors declare no conflict of interest.
Figures


Similar articles
-
Dissecting complex metabolic integration provides direct genetic evidence for CodY activation by guanine nucleotides.J Bacteriol. 2011 Oct;193(20):5637-48. doi: 10.1128/JB.05510-11. Epub 2011 Aug 19. J Bacteriol. 2011. PMID: 21856856 Free PMC article.
-
Role of branched-chain amino acid transport in Bacillus subtilis CodY activity.J Bacteriol. 2015 Apr;197(8):1330-8. doi: 10.1128/JB.02563-14. Epub 2015 Feb 2. J Bacteriol. 2015. PMID: 25645558 Free PMC article.
-
Positive regulation of Bacillus subtilis ackA by CodY and CcpA: establishing a potential hierarchy in carbon flow.Mol Microbiol. 2006 Nov;62(3):811-22. doi: 10.1111/j.1365-2958.2006.05410.x. Epub 2006 Sep 21. Mol Microbiol. 2006. PMID: 16995897
-
Control of key metabolic intersections in Bacillus subtilis.Nat Rev Microbiol. 2007 Dec;5(12):917-27. doi: 10.1038/nrmicro1772. Nat Rev Microbiol. 2007. PMID: 17982469 Review.
-
CodY, a master integrator of metabolism and virulence in Gram-positive bacteria.Curr Genet. 2017 Jun;63(3):417-425. doi: 10.1007/s00294-016-0656-5. Epub 2016 Oct 15. Curr Genet. 2017. PMID: 27744611 Review.
Cited by
-
Termination factor Rho mediates transcriptional reprogramming of Bacillus subtilis stationary phase.PLoS Genet. 2023 Feb 3;19(2):e1010618. doi: 10.1371/journal.pgen.1010618. eCollection 2023 Feb. PLoS Genet. 2023. PMID: 36735730 Free PMC article.
-
Genome-wide identification of Listeria monocytogenes CodY-binding sites.Mol Microbiol. 2020 Apr;113(4):841-858. doi: 10.1111/mmi.14449. Epub 2020 Feb 5. Mol Microbiol. 2020. PMID: 31944451 Free PMC article.
-
Interplay of CodY and ScoC in the Regulation of Major Extracellular Protease Genes of Bacillus subtilis.J Bacteriol. 2016 Jan 4;198(6):907-20. doi: 10.1128/JB.00894-15. J Bacteriol. 2016. PMID: 26728191 Free PMC article.
-
Developing rapid growing Bacillus subtilis for improved biochemical and recombinant protein production.Metab Eng Commun. 2020 Aug 15;11:e00141. doi: 10.1016/j.mec.2020.e00141. eCollection 2020 Dec. Metab Eng Commun. 2020. PMID: 32874915 Free PMC article.
-
Airway metabolic profiling during Streptococcus pneumoniae infection identifies branched chain amino acids as signatures of upper airway colonisation.PLoS Pathog. 2023 Sep 5;19(9):e1011630. doi: 10.1371/journal.ppat.1011630. eCollection 2023 Sep. PLoS Pathog. 2023. PMID: 37669280 Free PMC article.
References
-
- Henkin TM. The role of CcpA transcriptional regulator in carbon metabolism in Bacillus subtilis. FEMS Microbiol Lett. 1996;135(1):9–15. - PubMed
-
- Pratt LA, Hsing W, Gibson KE, Silhavy TJ. From acids to osmZ: Multiple factors influence synthesis of the OmpF and OmpC porins in Escherichia coli. Mol Microbiol. 1996;20(5):911–917. - PubMed
-
- Zheng M, Storz G. Redox sensing by prokaryotic transcription factors. Biochem Pharmacol. 2000;59(1):1–6. - PubMed
-
- den Hengst CD, et al. The Lactococcus lactis CodY regulon: Identification of a conserved cis-regulatory element. J Biol Chem. 2005;280(40):34332–34342. - PubMed
Publication types
MeSH terms
Substances
Associated data
Grants and funding
LinkOut - more resources
Full Text Sources
Other Literature Sources
Molecular Biology Databases

