

Determinants of intramyocellular lipid accumulation after dietary fat loading in non-obese men
- PMID: 24843504
- PMCID: PMC4014973
- DOI: 10.1111/j.2040-1124.2010.00091.x
Determinants of intramyocellular lipid accumulation after dietary fat loading in non-obese men
Abstract
Aims/Introduction: Accumulation of intramyocellular lipid (IMCL) is associated with insulin resistance. However, the factors affecting the change in IMCL remain to be elucidated. The aim of the present study was to determine the factors that influence the change in IMCL level after high-fat loading.
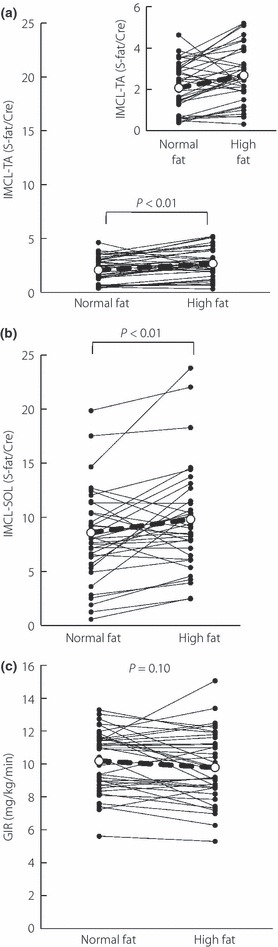
Materials and methods: The study subjects were 37 non-obese men. Each subject consumed a high-fat diet for 3 days after a normal-fat diet for 3 days. After each diet program, IMCL levels in the tibialis anterior (TA-IMCL) and soleus (SOL-IMCL) were measured by proton magnetic resonance spectroscopy. Glucose infusion rate (GIR) was evaluated by euglycemic hyperinsulinemic clamp as an index of peripheral insulin sensitivity.
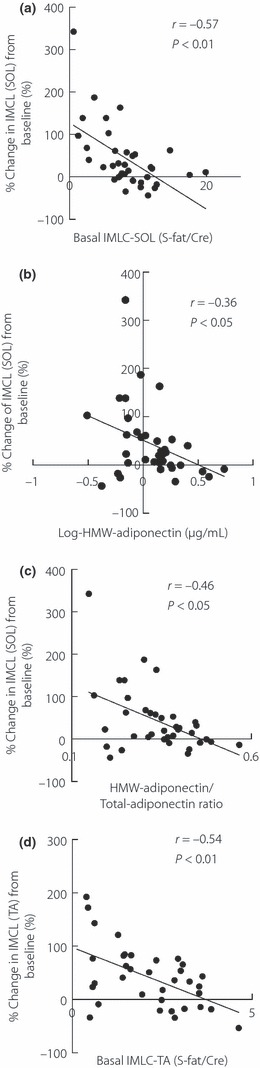
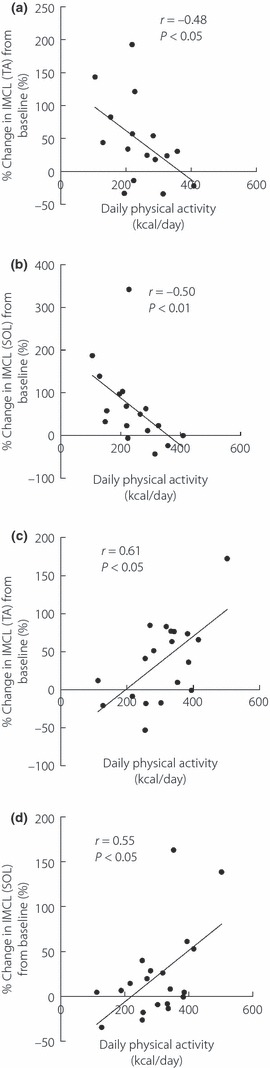
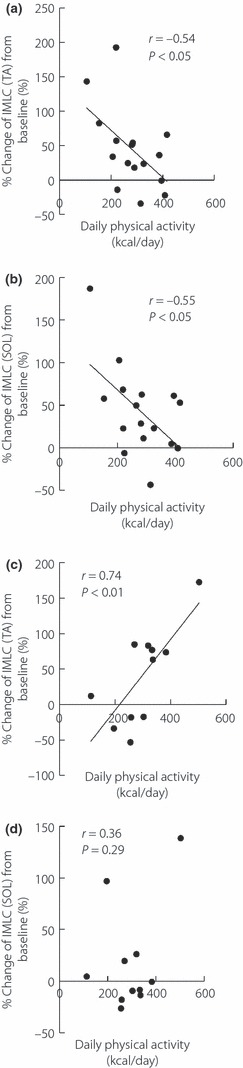
Results: The high-fat diet significantly increased TA-IMCL and SOL-IMCL by ∼30 and ∼20%, respectively (P < 0.05), whereas it did not significantly alter GIR. The increase in SOL-IMCL, but not in TA-IMCL, negatively correlated with serum high molecular weight (HMW)-adiponectin (r = -0.36, P < 0.05) and HMW-/total-adiponectin ratio (r = -0.46, P < 0.05). Although high-fat diet-related changes in SOL-IMCL showed high inter-individual variations, in subjects doing exercise, changes in SOL-IMCL (r = 0.55, P < 0.05) and TA-IMCL (r = 0.61, P < 0.05) positively correlated with daily physical activity level. In contrast, in sedentary subjects, changes in SOL-IMCL (r = -0.50, P < 0.01) and TA-IMCL (r = -0.48, P < 0.05) negatively correlated with daily physical activity.
Conclusions: HMW-adiponectin and daily physical activity are determinants of IMCL accumulation by a high-fat diet. Intriguingly, the effect of daily physical activity on the change in IMCL depends on the level of regular exercise. (J Diabetes Invest,doi: 10.1111/j.2040-1124.2010.00091.x, 2011).
Keywords: Adiponectin; Intramyocellular lipid; Physical activity.
Figures
Similar articles
-
Effects of intravenous and dietary lipid challenge on intramyocellular lipid content and the relation with insulin sensitivity in humans.Diabetes. 2001 Nov;50(11):2579-84. doi: 10.2337/diabetes.50.11.2579. Diabetes. 2001. PMID: 11679437
-
Short-term effects of dietary fat on intramyocellular lipid in sprinters and endurance runners.Metabolism. 2008 Mar;57(3):373-9. doi: 10.1016/j.metabol.2007.10.013. Metabolism. 2008. PMID: 18249210 Clinical Trial.
-
Intramyocellular lipids: anthropometric determinants and relationships with maximal aerobic capacity and insulin sensitivity.J Clin Endocrinol Metab. 2003 Apr;88(4):1785-91. doi: 10.1210/jc.2002-021674. J Clin Endocrinol Metab. 2003. PMID: 12679474
-
Morning to evening changes of intramyocellular lipid content in dependence on nutrition and physical activity during one single day: a volume selective 1H-MRS study.MAGMA. 2011 Feb;24(1):29-33. doi: 10.1007/s10334-010-0233-8. Epub 2011 Jan 7. MAGMA. 2011. PMID: 21213017
-
Increased intramyocellular lipid/impaired insulin sensitivity is associated with altered lipid metabolic genes in muscle of high responders to a high-fat diet.Am J Physiol Endocrinol Metab. 2016 Jan 1;310(1):E32-40. doi: 10.1152/ajpendo.00220.2015. Epub 2015 Oct 20. Am J Physiol Endocrinol Metab. 2016. PMID: 26487001 Clinical Trial.
Cited by
-
The Effects of Diet on the Proportion of Intramuscular Fat in Human Muscle: A Systematic Review and Meta-analysis.Front Nutr. 2018 Feb 20;5:7. doi: 10.3389/fnut.2018.00007. eCollection 2018. Front Nutr. 2018. PMID: 29516003 Free PMC article. Review.
-
Fatty Liver Has Stronger Association With Insulin Resistance Than Visceral Fat Accumulation in Nonobese Japanese Men.J Endocr Soc. 2019 May 20;3(7):1409-1416. doi: 10.1210/js.2019-00052. eCollection 2019 Jul 1. J Endocr Soc. 2019. PMID: 31286107 Free PMC article.
-
The Flexibility of Ectopic Lipids.Int J Mol Sci. 2016 Sep 14;17(9):1554. doi: 10.3390/ijms17091554. Int J Mol Sci. 2016. PMID: 27649157 Free PMC article. Review.
-
Intramyocellular triacylglycerol accumulation across weight loss strategies; Sub-study of the CENTRAL trial.PLoS One. 2017 Nov 30;12(11):e0188431. doi: 10.1371/journal.pone.0188431. eCollection 2017. PLoS One. 2017. PMID: 29190720 Free PMC article. Clinical Trial.
-
Endurance Runners with Intramyocellular Lipid Accumulation and High Insulin Sensitivity Have Enhanced Expression of Genes Related to Lipid Metabolism in Muscle.J Clin Med. 2020 Dec 6;9(12):3951. doi: 10.3390/jcm9123951. J Clin Med. 2020. PMID: 33291227 Free PMC article.
References
-
- Boden G, Shulman GI. Free fatty acids in obesity and type 2 diabetes: defining their role in the development of insulin resistance and beta‐cell dysfunction. Eur J Clin Invest 2002; 32(Suppl. 3): 14–23 - PubMed
-
- Kelley DE, Goodpaster BH, Storlien L. Muscle triglyceride and insulin resistance. Annu Rev Nutr 2002; 22: 325–346 - PubMed
-
- Perseghin G, Petersen K, Shulman GI. Cellular mechanism of insulin resistance: potential links with inflammation. Int J Obes Relat Metab Disord 2003; 27(Suppl. 3): S6–S11 - PubMed
-
- Bachmann OP, Dahl DB, Brechtel K, et al. Effects of intravenous and dietary lipid challenge on intramyocellular lipid content and the relation with insulin sensitivity in humans. Diabetes 2001; 50: 2579–2584 - PubMed
-
- Krssak M, Falk Petersen K, Dresner A, et al. Intramyocellular lipid concentrations are correlated with insulin sensitivity in humans: a 1H NMR spectroscopy study. Diabetologia 1999; 42: 113–116 - PubMed
LinkOut - more resources
Full Text Sources
