. 2012 Feb 20;3(1):80-5.
doi: 10.1111/j.2040-1124.2011.00143.x.

Effects of glucose and meal ingestion on incretin secretion in Japanese subjects with normal glucose tolerance

Affiliations

Effects of glucose and meal ingestion on incretin secretion in Japanese subjects with normal glucose tolerance

Shunsuke Yamane et al. J Diabetes Investig. .

Abstract

Aims/Introduction: Gastric inhibitory polypeptide (GIP) and glucagon-like peptide-1 (GLP-1) are the major incretins; their secretion after various nutrient loads are well-evaluated in Caucasians. However, little is known of the relationship between incretin secretion and differing nutritional loading in Japanese subjects. In the present study, we evaluated GIP and GLP-1 secretion in Japanese subjects with normal glucose tolerance (NGT) after glucose loading (75 g glucose and 17 g glucose) and meal ingestion.

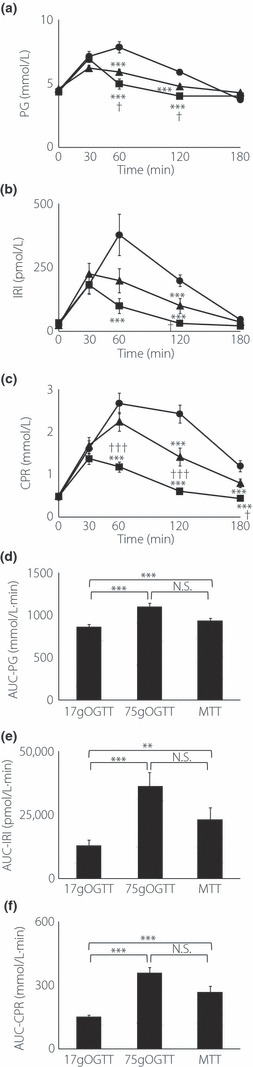
Materials and methods: A total of 10 Japanese NGT subjects participated in 75 g oral glucose tolerance test (OGTT), 17 g OGTT and meal tolerance test (MTT). Plasma glucose (PG), serum insulin (IRI), serum C-peptide (CPR), plasma total GIP, and plasma total GLP-1 levels during OGTT and MTT were determined.

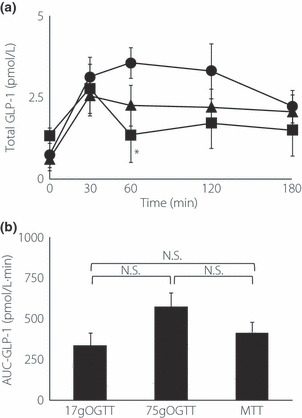
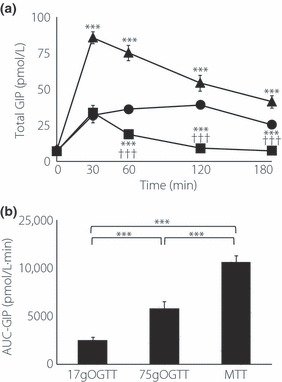
Results: Area under the curve (AUC)-GIP was increased in proportion to the amount of glucose, and was highest in MTT, showing that GIP secretion is also stimulated by nutrients other than glucose, such as lipid. In contrast, although the larger glucose load tended to induce a larger GLP-1 release, AUC-GLP-1 was not significantly different among the three loading tests (75 g OGTT, 17 g OGTT, MTT) irrespective of the kind or amount of nutrition load.

Conclusions: Our results suggest that nutritional composition might have a greater effect on GIP secretion than that on GLP-1 secretion in Japanese NGT subjects. (J Diabetes Invest, doi: 10.1111/j.2040-1124.2011.00143.x, 2012).

Keywords: Incretin; Meal tolerance test; Oral glucose tolerance test.


Figures

Figure 1
Figure 1
Concentrations of (a) plasma glucose (PG), (b) serum insulin (IRI) and (c) serum C‐peptide (CPR) during the 75 g oral glucose tolerance test (OGTT; closed circle), 17 g OGTT (closed square) and meal tolerance test (MTT; closed triangle) in 10 Japanese subjects. Asterisks indicate significant differences vs 75 g OGTT at individual time‐points (*P < 0.05, **P < 0.01, ***P < 0.001); daggers indicate significant differences vs MTT at individual time‐points (†P < 0.05, ††P < 0.01, †††P < 0.001). (d) Area under the curve (AUC)‐PG, (e) AUC‐IRI, (f) AUC‐CPR were calculated by the trapezoidal rule. Asterisks indicate significant differences at individual time‐points (*P < 0.05, **P < 0.01, ***P < 0.001). Statistical analyses were carried out using anova and unpaired Student’s t‐test. P‐values <0.05 were considered statistically significant. Data are presented as mean ± standard error. N.S., not significant.
Figure 2
Figure 2
(a) Concentrations of total glucagon‐like peptide‐1 (GLP‐1) during the 75 g oral glucose tolerance test (OGTT; closed circle), 17 g OGTT(closed square) and meal tolerance test (MTT; closed triangle) in 10 Japanese subjects. Asterisks indicate significant differences vs 75 g OGTT at individual time‐points (*P < 0.05, **P < 0.01, ***P < 0.001); daggers indicate significant differences vs MTT at individual time‐points (†P < 0.05, ††P < 0.01, †††P < 0.001). (b) Area under the curve (AUC)‐GLP‐1 was calculated by the trapezoidal rule. Asterisks indicate significant differences at individual time‐points (*P < 0.05, **P < 0.01, ***P < 0.001). Statistical analyses were carried out using anova and unpaired Student’s t‐test. P‐values <0.05 were considered statistically significant. Data are presented as mean ± standard error. N.S., not significant.
Figure 3
Figure 3
(a) Concentrations of total gastric inhibitory polypeptide (GIP) during 75 g oral glucose tolerance test (OGTT; closed circle), 17 g OGTT (closed square) and meal tolerance test (MTT; closed triangle) in 10 Japanese subjects. Asterisks indicate significant differences vs 75 g OGTT at individual time‐points (*P < 0.05, **P < 0.01, ***P < 0.001); daggers indicate significant differences vs MTT at individual time‐points (†P < 0.05, ††P < 0.01, †††P < 0.001). (b) Area under the curve (AUC)‐GIP was calculated by the trapezoidal rule. Asterisks indicate significant differences at individual time‐points (*P < 0.05, **P < 0.01, ***P < 0.001). Statistical analyses were carried out using anova and unpaired Student’s t‐test. P‐values <0.05 were considered statistically significant. Data are presented as mean ± standard error.

References

    1. Nauck MA, Homberger E, Siegel EG, et al. Incretin effects of increasing glucose loads in man calculated from venous insulin and C‐peptide responses. J Clin Endocrinol Metab 1986; 63: 492–498 - PubMed
    1. Seino Y, Fukushima M, Yabe D. GIP and GLP‐1, the two incretin hormone: similarities and difference. J Diabetes Invest 2010; 1: 8–23 - PMC - PubMed
    1. Nauck M, Stockmann F, Ebert R, et al. Reduced incretin effect in type 2 (non‐insulin‐dependent) diabetes. Diabetologia 1986; 29: 46–52 - PubMed
    1. Muscelli E, Mari A, Casolaro A, et al. Separate impact of obesity and glucose tolerance on the incretin effect in normal subjects and type 2 diabetic patients. Diabetes 2008; 57: 1340–1348 - PubMed
    1. Vilsboll T, Krarup T, Deacon CF, et al. Reduced postprandial concentrations of intact biologically active glucagon‐like peptide 1 in type 2 diabetic patients. Diabetes 2001; 50: 609–613 - PubMed

LinkOut - more resources