. 2012 Oct 18;3(5):432-40.
doi: 10.1111/j.2040-1124.2012.00208.x.

Ingestion of a moderate high-sucrose diet results in glucose intolerance with reduced liver glucokinase activity and impaired glucagon-like peptide-1 secretion

Affiliations

Ingestion of a moderate high-sucrose diet results in glucose intolerance with reduced liver glucokinase activity and impaired glucagon-like peptide-1 secretion

Eriko Sakamoto et al. J Diabetes Investig. .

Abstract

Aims/Introduction: Excessive intake of sucrose can cause severe health issues, such as diabetes mellitus. In animal studies, consumption of a high-sucrose diet (SUC) has been shown to cause obesity, insulin resistance and glucose intolerance. However, several in vivo experiments have been carried out using diets with much higher sucrose contents (50-70% of the total calories) than are typically ingested by humans. In the present study, we examined the effects of a moderate SUC on glucose metabolism and the underlying mechanism.

Materials and methods: C57BL/6J mice received a SUC (38.5% sucrose), a high-starch diet (ST) or a control diet for 5 weeks. We assessed glucose tolerance, incretin secretion and liver glucose metabolism.

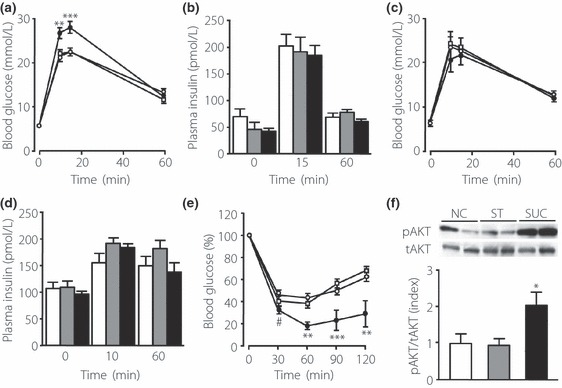
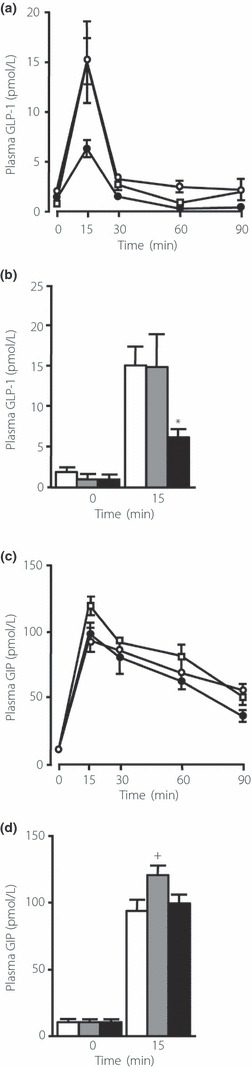
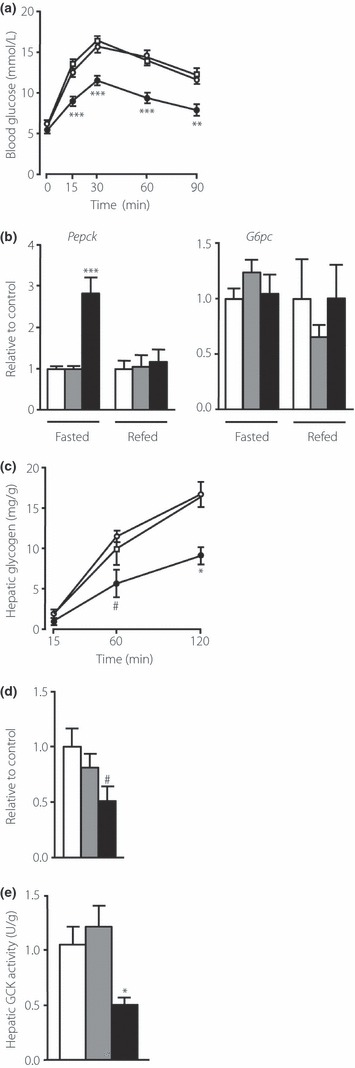
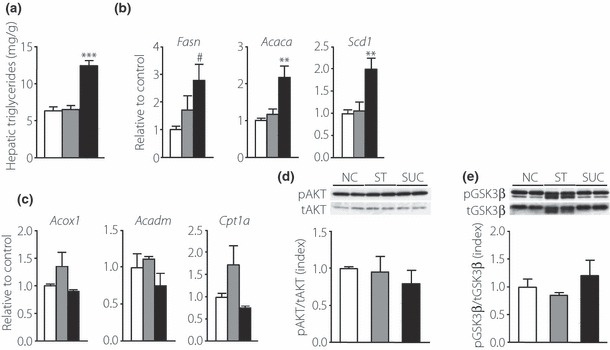
Results: An oral glucose tolerance test (OGTT) showed that plasma glucose levels in the early phase were significantly higher in SUC-fed mice than in ST-fed or control mice, with no change in plasma insulin levels at any stage. SUC-fed mice showed a significant improvement in insulin sensitivity. Glucagon-like peptide-1 (GLP-1) secretion 15 min after oral glucose administration was significantly lower in SUC-fed mice than in ST-fed or control mice. Hepatic glucokinase (GCK) activity was significantly reduced in SUC-fed mice. During the OGTT, the accumulation of glycogen in the liver was suppressed in SUC-fed mice in a time-dependent manner.

Conclusions: These results indicate that mice that consume a moderate SUC show glucose intolerance with a reduction in hepatic GCK activity and impairment in GLP-1 secretion. (J Diabetes Invest, doi: 10.1111/j.2040-1124.2012.00208.x, 2012).

Keywords: Glucagon‐like peptide‐1; Glucokinase; High‐sucrose diet.


Figures

Figure 1
Figure 1
Characterization of glucose tolerance and insulin sensitivity in mice fed a high‐starch diet (ST) and a high‐sucrose diet (SUC), after 5 weeks of feeding. (a) Blood glucose levels during an oral glucose tolerance test (OGTT) in mice fed a normal chow diet (NC; open circle, n = 11), a ST (open square, n = 10) or a SUC (filled circle, n = 12). Glucose was given orally at a dose of 2 g/kg. (b) Plasma insulin levels during the OGTT in mice fed a NC (white bars), a ST (gray bars) or a SUC (black bars). (c) Blood glucose levels during an intravenous glucose tolerance test (IVGTT). Glucose (2 g/kg) was given intravenously to mice fed a NC (open circle, n = 8), a ST (open square, n = 9) or a SUC (filled circle, n = 5). (d) Plasma insulin levels during the IVGTT in mice fed a NC (white bars), a ST (gray bars) or a SUC (black bars). (e) Blood glucose levels during the insulin tolerance test in mice fed a NC (open circle, n = 10), a ST (open square, n = 12) or a SUC (filled circle, n = 7). Insulin was injected intraperitoneally at a dose of 0.6 U/kg. (f) Representative immunoblots and quantification of AKT phosphorylation by insulin in the skeletal muscle. AKT phosphorylation is expressed as the ratio of phospho‐AKT (pAKT) relative to the total amount of AKT. White, gray and black bars indicate data from mice fed a NC (n = 5), a ST (n = 5) or a SUC (n = 5), respectively. Values are mean ± SEM. *P < 0.05; **P < 0.01; ***P < 0.001 compared with the NC‐ and ST‐fed mice at the indicated time‐points. #P < 0.05 compared with the NC‐fed mice at the indicated time points. tAKT, total AKT.
Figure 2
Figure 2
Effects of carbohydrates on incretin secretion. (a) Time course of total glucagon‐like peptide‐1 (GLP‐1) levels after oral glucose administration in mice fed a normal chow diet (NC; open circle), a high‐starch diet (ST; open square), or a high‐sucrose diet (SUC; filled circle). (b) The plasma levels of total GLP‐1 at baseline and 15 min after oral glucose loading in mice fed a NC (white bars, n =15), a ST (gray bars, n =11–15), or a SUC (black bars, n = 16). (c) Time course of total glucose‐dependent insulinotropic polypeptide (GIP) levels after oral glucose administration in mice fed a NC (open circle), a ST (open square) or a SUC (filled circle). (d) The plasma levels of total GIP at baseline and 15 min after oral glucose loading in mice fed a NC (white bars, n = 13–14), a ST (gray bars, n = 11–18) or a SUC (black bars, n = 14–17). Values are mean ± SEM. *P < 0.05 compared with the NC‐ and ST‐fed mice. +P < 0.05 compared with the NC‐ and SUC‐fed mice.
Figure 3
Figure 3
Effects of carbohydrates on hepatic glucose metabolism. (a) Blood glucose levels during the pyruvate tolerance test in mice fed normal chow diet (NC; open circle, n = 8), a high‐starch diet (ST; open square, n = 10) or a high‐sucrose diet (SUC; filled circle, n = 6). Pyruvate was given intravenously at a dose of 2 g/kg. (b) Messenger ribonucleic acid (mRNA) expression of glucose‐6‐phosphatase (G6pc) and phosphoenolpyruvate carboxykinase (Pepck) in the liver in fasted and re‐fed states. (c) Hepatic glycogen content during an oral glucose tolerance test in mice fed a NC (open circle, n = 3–5), a ST (open square, n = 3) or a SUC (filled circle, n = 3–5). (d) The mRNA expression of glucokinase (Gck) in the liver in a fasted state. In (b) and (d), mRNA abundance relative to 36B4 was determined using real‐time polymerase chain reaction (PCR) and expressed as a fold increase relative to the control. White, gray and black bars indicate data from mice fed a NC (n = 7–8), a ST (n = 6–7) or a SUC (n = 5–8), respectively. (e) Total GCK activity in the livers of mice fed a NC (white bars, n = 4), a ST (gray bars, n = 4) or a SUC (black bars, n = 4). Values are mean ± SEM. *P < 0.05; **P < 0.01; ***P < 0.001 compared with the NC‐ and ST‐fed mice at the indicated time‐points. #P < 0.05 compared with the NC‐fed mice at the indicated time‐points.
Figure 4
Figure 4
Effects of carbohydrates on hepatic lipid metabolism. (a) Hepatic triglyceride content in the livers of mice fed a normal chow diet (NC; white bars, n = 6), a high‐starch diet (ST; gray bars, n = 8) or a high‐sucrose diet (SUC; black bars, n = 9). (b) Messenger ribonucleic acid (mRNA) expression of the lipogenic enzymes fatty acid synthase (Fasn), acetyl‐CoA carboxylase α (Acaca) and stearoyl‐CoA desaturase 1 (Scd1) and (c) the lipolytic enzymes acyl‐CoA oxidase (Acox1), medium‐chain acyl‐CoA dehydrogenase (Acadm), and carnitine palmitoyltransferase 1α (Cpt1a) in the livers of mice fed a NC (white bars, n = 6), a ST (gray bars, n = 7–8) or a SUC (black bars, n = 5–7). The abundance of mRNA relative to 36B4 mRNA was determined using real‐time polymerase chain reaction, and is expressed as a fold increase relative to the control. (d, e) Insulin‐induced phosphorylation of AKT and glycogen synthase kinase‐3β (GSK‐3β) in the liver. Mice were injected intravenously with insulin. Liver was extracted 3 min after the injection, and immunoblotted with indicated antibodies. (d) Representative immunoblots and quantification of the phosphorylation of AKT by insulin. AKT phosphorylation is expressed as the ratio of phospho‐AKT (pAKT) relative to the total amount of AKT. (e) Representative immunoblots and quantification of the phosphorylation of GSK‐3β by insulin. GSK‐3β phosphorylation is expressed as the ratio of phospho‐GSK‐3β (pGSK‐3β) relative to the total amount of GSK‐3β. White, gray and black bars indicate data from mice fed a NC (n = 3), a ST (n = 3) or a SUC (n = 3), respectively. Values are mean ± SEM. **P < 0.01; ***P < 0.001 compared with the NC‐ and ST‐fed mice. #P < 0.05 compared with the NC‐fed mice. tAKT, total AKT; tGSK‐3β, total GSK‐3β.

References

    1. Laville M, Nazare JA. Diabetes, insulin resistance and sugars. Obes Rev 2009; 10(Suppl 1): 24–33 - PubMed
    1. Bray GA, Nielsen SJ, Popkin BM. Consumption of high‐fructose corn syrup in beverages may play a role in the epidemic of obesity. Am J Clin Nutr 2004; 79: 537–543 - PubMed
    1. Vos MB, Kimmons JE, Gillespie C, et al. Dietary fructose consumption among US children and adults: the Third National Health and Nutrition Examination Survey. Medscape J Med 2008; 10: 160 - PMC - PubMed
    1. Johnson RJ, Segal MS, Sautin Y, et al. Potential role of sugar (fructose) in the epidemic of hypertension, obesity and the metabolic syndrome, diabetes, kidney disease, and cardiovascular disease. Am J Clin Nutr 2007; 86: 899–906 - PubMed
    1. Pagliassotti MJ, Shahrokhi KA, Moscarello M. Involvement of liver and skeletal muscle in sucrose‐induced insulin resistance: dose‐response studies. Am J Physiol 1994; 266: R1637–R1644 - PubMed

LinkOut - more resources