Review
. 2014 Sep;58(3):129-44.
Epub 2014 May 20.

Structural and connectomic neuroimaging for the personalized study of longitudinal alterations in cortical shape, thickness and connectivity after traumatic brain injury

Affiliations
Review

Structural and connectomic neuroimaging for the personalized study of longitudinal alterations in cortical shape, thickness and connectivity after traumatic brain injury

A Irimia et al. J Neurosurg Sci. 2014 Sep.

Abstract

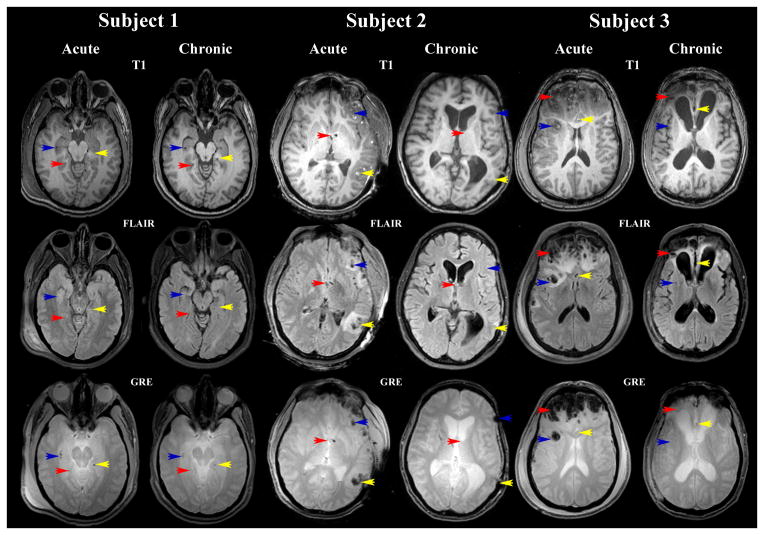
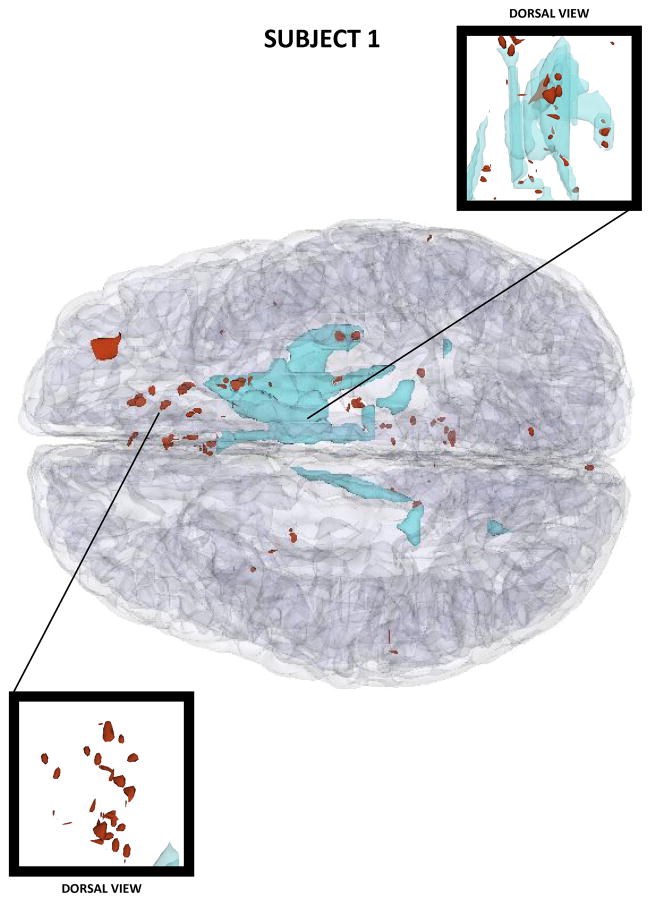
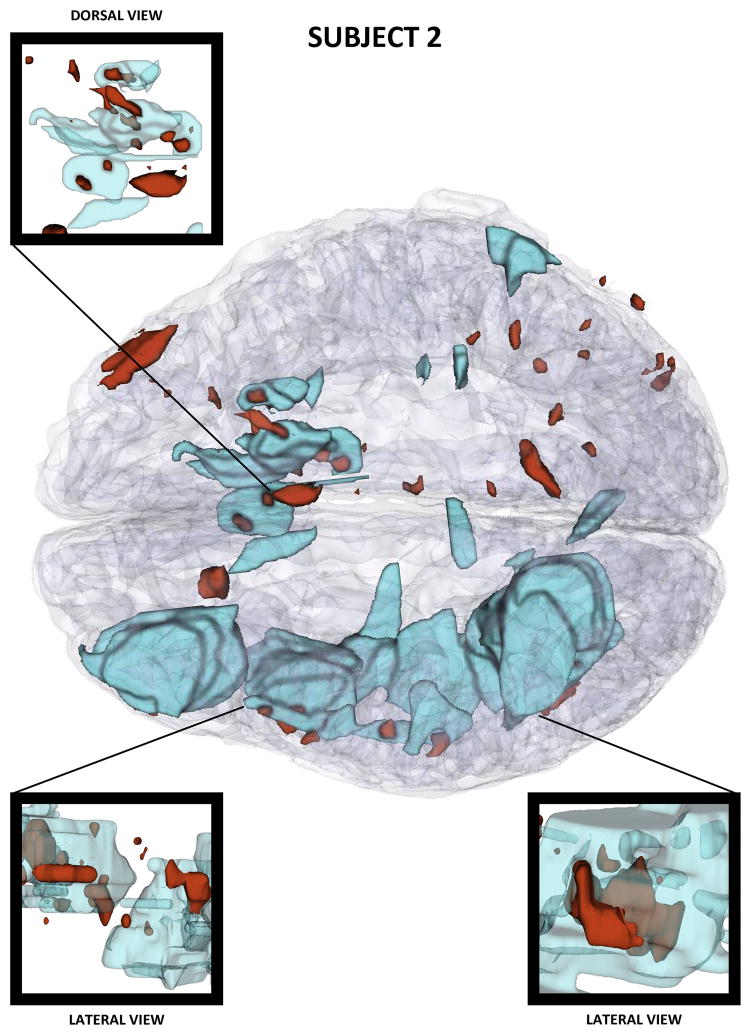
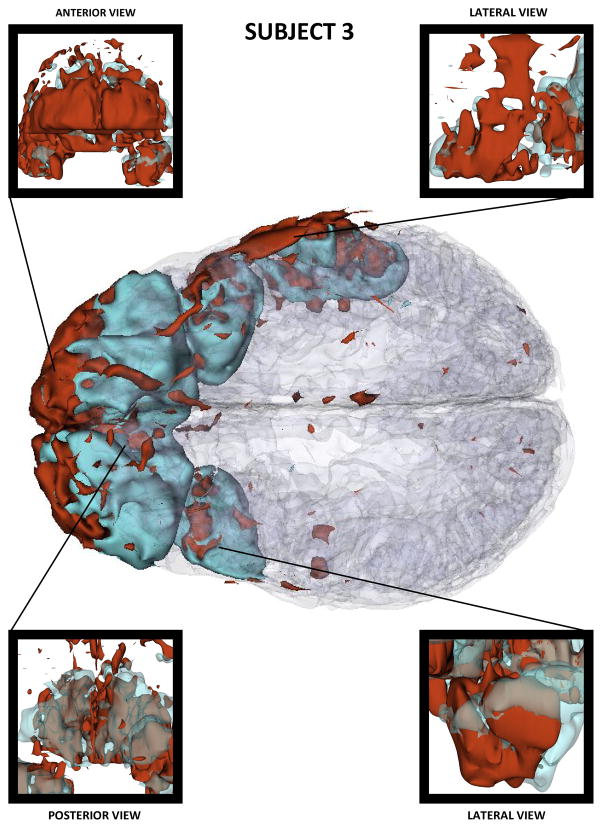
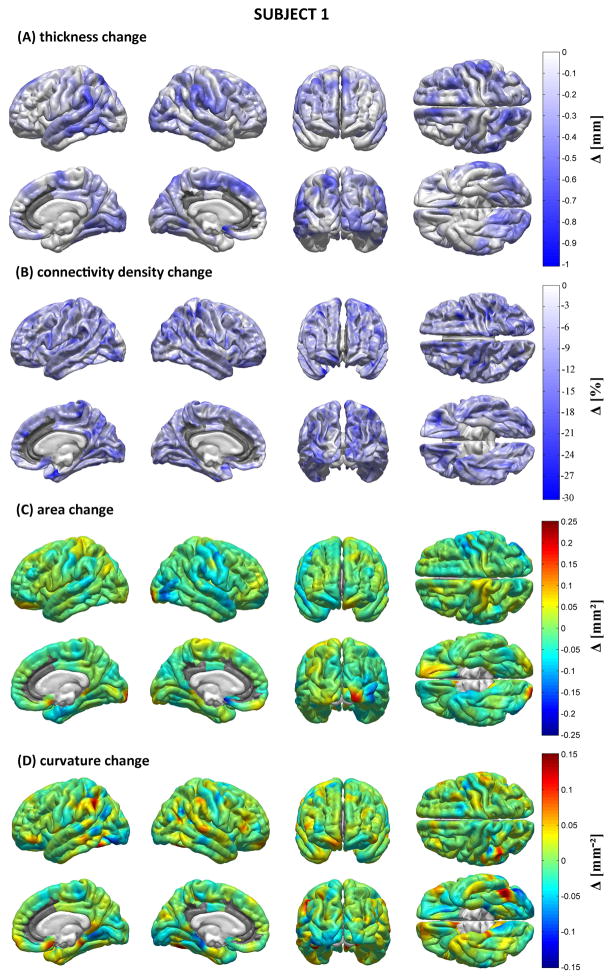
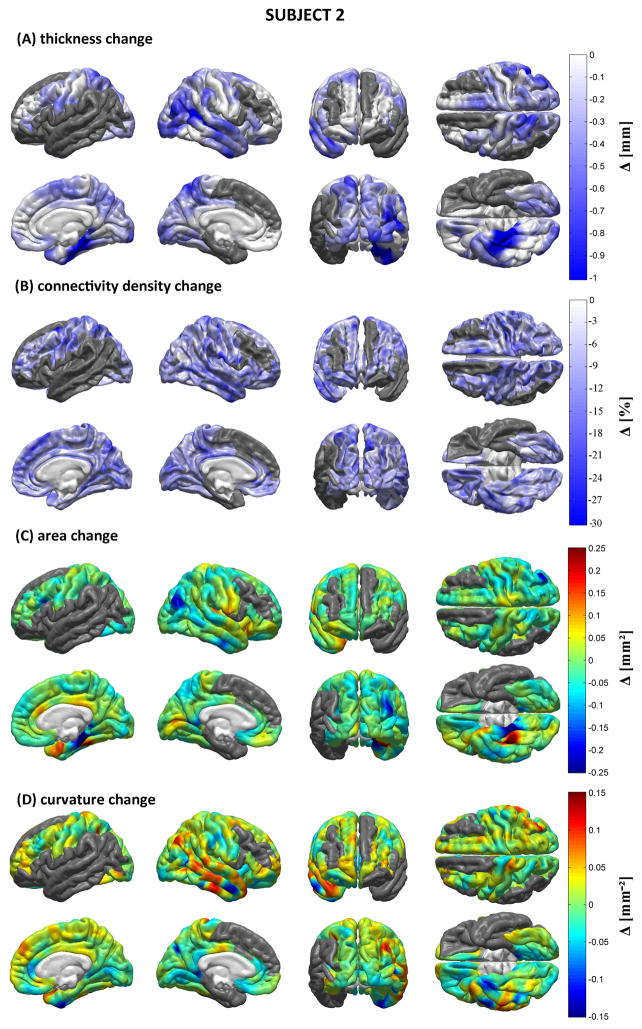
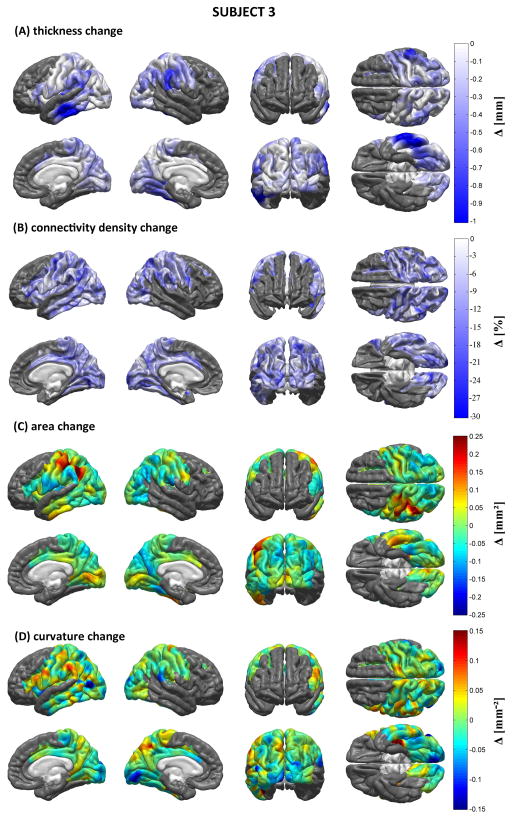
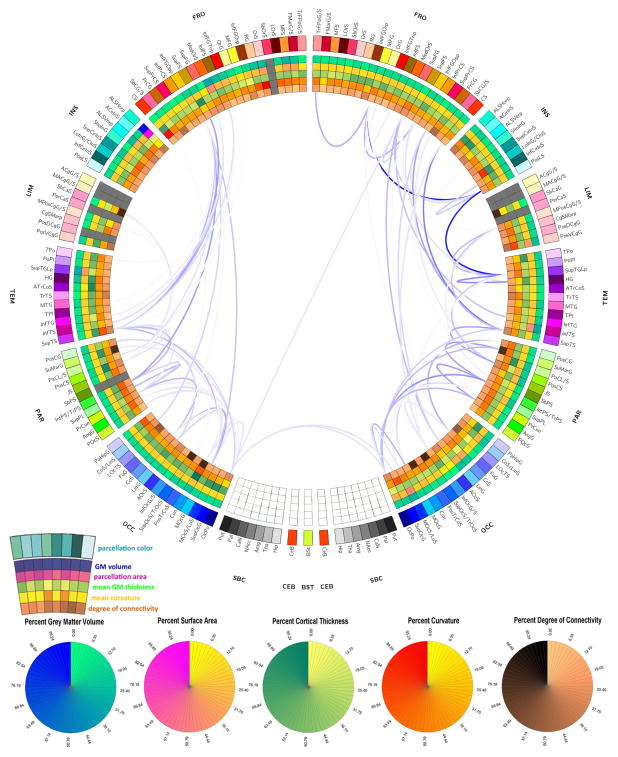
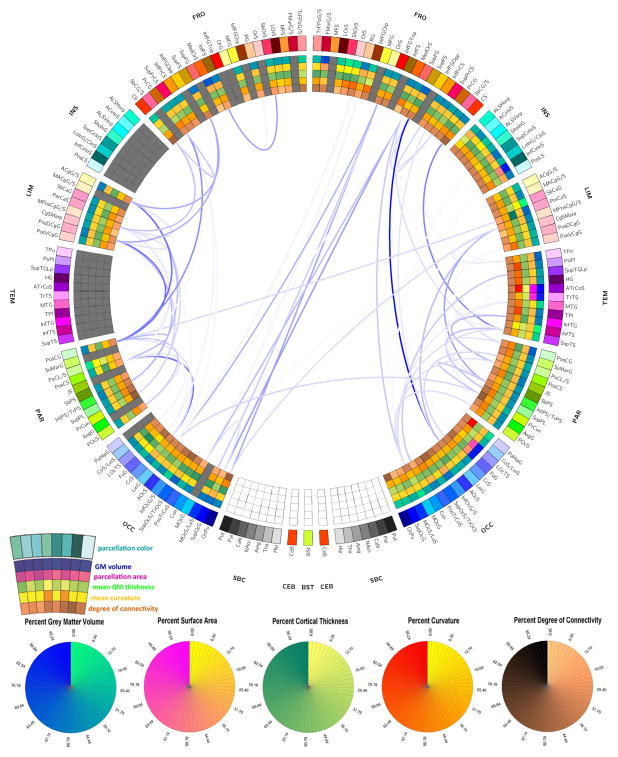
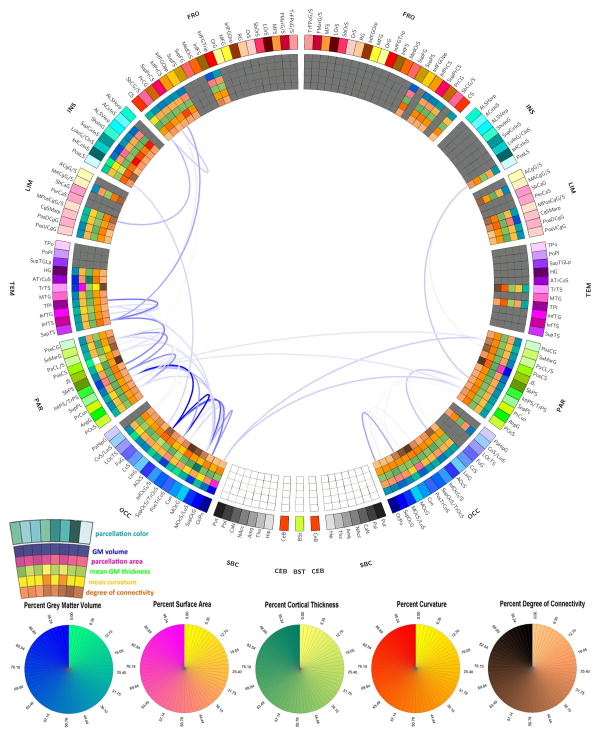
The integration of longitudinal brain structure analysis with neurointensive care strategies continues to be a substantial difficulty facing the traumatic brain injury (TBI) research community. For patient-tailored case analysis, it remains challenging to establish how lesion profile modulates longitudinal changes in cortical structure and connectivity, as well as how these changes lead to behavioral, cognitive and neural dysfunction. Additionally, despite the clinical potential of morphometric and connectomic studies, few analytic tools are available for their study in TBI. Here we review the state of the art in structural and connectomic neuroimaging for the study of TBI and illustrate a set of recently-developed, patient-tailored approaches for the study of TBI-related brain atrophy and alterations in morphometry as well as inter-regional connectivity. The ability of such techniques to quantify how injury modulates longitudinal changes in cortical shape, structure and circuitry is highlighted. Quantitative approaches such as these can be used to assess and monitor the clinical condition and evolution of TBI victims, and can have substantial translational impact, especially when used in conjunction with measures of neuropsychological function.


Conflict of interest statement

Conflicts of interest: The authors report no actual or perceived conflict of interest.

Figures

Figure 1
Figure 1
Sample MR images displayed in radiological convention for three TBI cases. The sequence types shown include T1, FLAIR and GRE. Red, yellow and blue arrows identify the locations of three different insults which are visible using all three sequences.
Figure 2
Figure 2
Three-dimensional model of TBI anatomy for Patient 1 (acute baseline time point), as generated in 3D Slicer. Non-hemorrhagic and hemorrhagic lesions are displayed in cyan and red, respectively. The GM is shown using a transparent model.
Figure 3
Figure 3
As in Figure 2, for Patient 2.
Figure 4
Figure 4
As in Figure 2, for Patient 3.
Figure 5
Figure 5
Morphometric analysis for Patient 1. Shown are longitudinal changes (Δ) in cortical thickness (A), connectivity density (B), cortical surface area (C) and Gaussian curvature (D) from the acute to the chronic time point. Regions whose metrics could not be computed accurately due to lesion-related loss of MR image contrast at the WM/GM boundary are grayed out.
Figure 6
Figure 6
As in Figure 5, for Patient 2.
Figure 7
Figure 7
As in Figure 5, for Patient 3.
Figure 8
Figure 8
Connectogram representation of WM atrophy in Patient 1. The outermost ring shows the various brain regions arranged by lobe (FR – frontal; INS – insula; LIM – limbic; TEM – temporal; PAR –parietal; OCC – occipital; NC – non-cortical; BS – brain stem; CeB - cerebellum) and further ordered anterior-to-posterior. The set of five rings (from the outside going inward) use colors to encode the percentage change in the following five measures over 6 months (from the acute to the chronic time point): GM volume, parcel area, mean GM thickness, mean curvature, and degree of connectivity. A link is drawn between two regions if the connectivity density of the connection represented by that link has experienced a longitudinal decrease D which satisfies the inequality |D| ≥ μ (D) + 2σ (D), where μ (D) and σ (D) denote the mean and standard deviation of D over all reconstructed WM connections. Link transparency encodes |D| from its lowest value (faintest hue) to its highest one (darkest hue). Heat map entries for structures which had been affected by gross pathology are drawn in gray. For further details, see the Methods section.
Figure 9
Figure 9
As in Figure 8, for Patient 2.
Figure 10
Figure 10
As in Figure 8, for Patient 3.

References

    1. Irimia A, Chambers MC, Torgerson CM, Filippou M, Hovda DA, Alger JR, et al. Patient-tailored connectomics visualization for the assessment of white matter atrophy in traumatic brain injury. Front Neurol. 2012;3:10. - PMC - PubMed
    1. Gentry LR, Godersky JC, Thompson B. MR imaging of head trauma: review of the distribution and radiopathologic features of traumatic lesions. AJR Am J Roentgenol. 1988;150(3):663–72. - PubMed
    1. Irimia A, Wang B, Aylward SR, Prastawa MW, Pace DF, Gerig G, et al. Neuroimaging of structural pathology and connectomics in traumatic brain injury: Toward personalized outcome prediction. Neuroimage Clin. 2012;1(1):1–17. - PMC - PubMed
    1. Faden AI, Demediuk P, Panter SS, Vink R. The role of excitatory amino acids and NMDA receptors in traumatic brain injury. Science. 1989;244(4906):798–800. - PubMed
    1. Kirkby BS, Van Horn JD, Ostrem JL, Weinberger DR, Berman KF. Cognitive activation during PET: a case study of monozygotic twins discordant for closed head injury. Neuropsychologia. 1996;34(7):689–97. - PubMed

Publication types

LinkOut - more resources