

Avidity-dependent programming of autoreactive T cells in T1D
- PMID: 24844227
- PMCID: PMC4028311
- DOI: 10.1371/journal.pone.0098074
Avidity-dependent programming of autoreactive T cells in T1D
Abstract
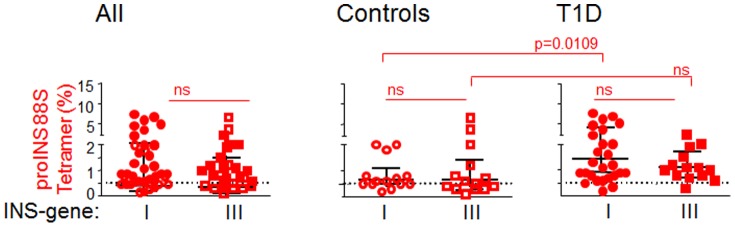
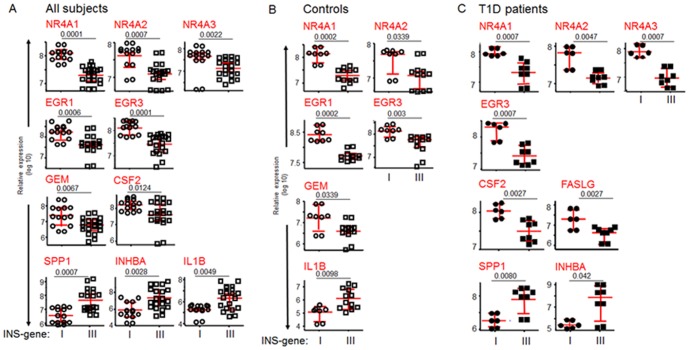
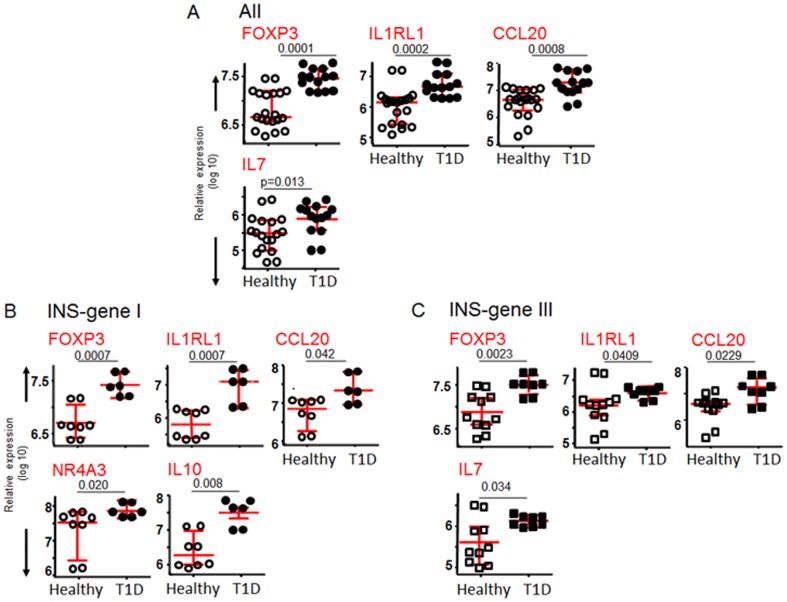
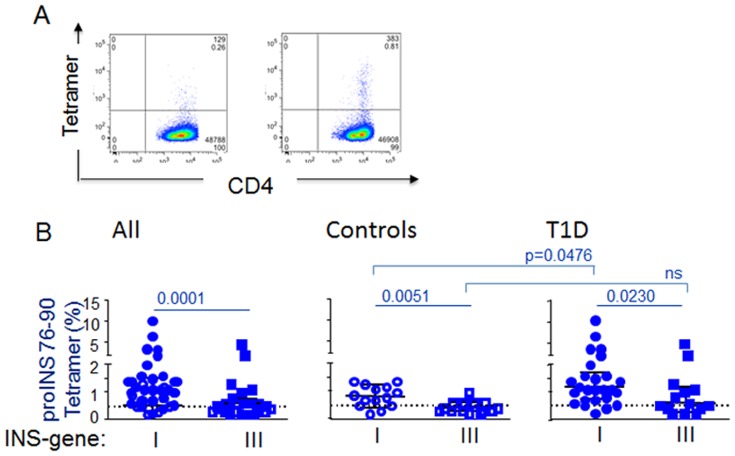
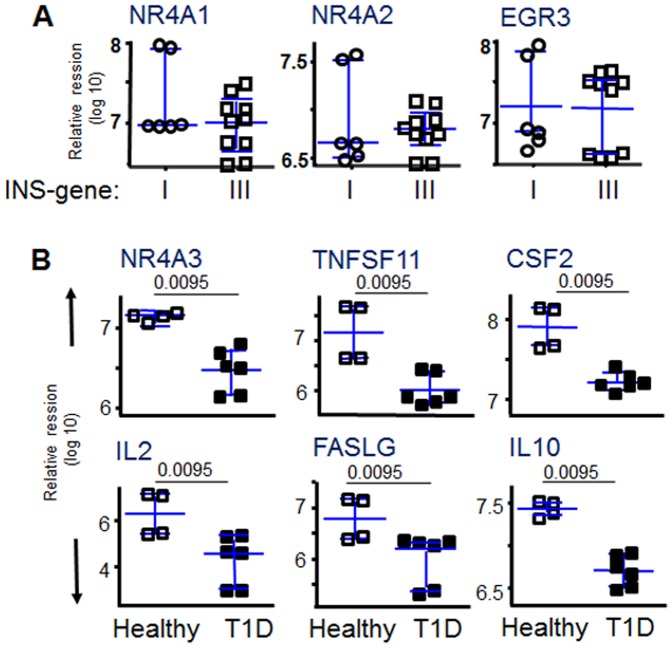
Fate determination for autoreactive T cells relies on a series of avidity-dependent interactions during T cell selection, represented by two general types of signals, one based on antigen expression and density during T cell development, and one based on genes that interpret the avidity of TCR interaction to guide developmental outcome. We used proinsulin-specific HLA class II tetramers to purify and determine transcriptional signatures for autoreactive T cells under differential selection in type 1 diabetes (T1D), in which insulin (INS) genotypes consist of protective and susceptible alleles that regulate the level of proinsulin expression in the thymus. Upregulation of steroid nuclear receptor family 4A (NR4A) and early growth response family genes in proinsulin-specific T cells was observed in individuals with susceptible INS-VNTR genotypes, suggesting a mechanism for avidity-dependent fate determination of the T cell repertoire in T1D. The NR4A genes act as translators of TCR signal strength that guide central and peripheral T cell fate decisions through transcriptional modification. We propose that maintenance of an NR4A-guided program in low avidity autoreactive T cells in T1D reflects their prior developmental experience influenced by proinsulin expression, identifying a pathway permissive for autoimmunity.
Conflict of interest statement
Figures
Similar articles
-
Insulin gene VNTR genotype associates with frequency and phenotype of the autoimmune response to proinsulin.Genes Immun. 2010 Mar;11(2):188-93. doi: 10.1038/gene.2009.108. Epub 2010 Jan 7. Genes Immun. 2010. PMID: 20054344 Free PMC article.
-
Proinsulin C-peptide is an autoantigen in people with type 1 diabetes.Proc Natl Acad Sci U S A. 2018 Oct 16;115(42):10732-10737. doi: 10.1073/pnas.1809208115. Epub 2018 Oct 1. Proc Natl Acad Sci U S A. 2018. PMID: 30275329 Free PMC article.
-
Autoimmune responses to the beta cell autoantigen, insulin, and the INS VNTR-IDDM2 locus.Clin Exp Immunol. 1998 Dec;114(3):370-6. doi: 10.1046/j.1365-2249.1998.00744.x. Clin Exp Immunol. 1998. PMID: 9844045 Free PMC article.
-
Analysis of antigen specific T cells in diabetes - Lessons from pre-clinical studies and early clinical trials.J Autoimmun. 2016 Jul;71:35-43. doi: 10.1016/j.jaut.2016.03.018. Epub 2016 Apr 12. J Autoimmun. 2016. PMID: 27083395 Review.
-
The Role of T Cell Receptor Signaling in the Development of Type 1 Diabetes.Front Immunol. 2021 Feb 2;11:615371. doi: 10.3389/fimmu.2020.615371. eCollection 2020. Front Immunol. 2021. PMID: 33603744 Free PMC article. Review.
Cited by
-
Lymphocyte repertoire selection and intracellular self/non-self-discrimination: historical overview.Immunol Cell Biol. 2015 Mar;93(3):297-304. doi: 10.1038/icb.2014.96. Epub 2014 Nov 11. Immunol Cell Biol. 2015. PMID: 25385066 Review.
-
Prediction and prevention of type 1 diabetes: update on success of prediction and struggles at prevention.Pediatr Diabetes. 2015 Nov;16(7):465-84. doi: 10.1111/pedi.12299. Epub 2015 Jul 23. Pediatr Diabetes. 2015. PMID: 26202050 Free PMC article. Review.
-
Neuropilin-1 (NRP1) expression distinguishes self-reactive helper T cells in systemic autoimmune disease.EMBO Mol Med. 2022 Oct 10;14(10):e15864. doi: 10.15252/emmm.202215864. Epub 2022 Sep 7. EMBO Mol Med. 2022. PMID: 36069030 Free PMC article.
-
Immunogenetics of type 1 diabetes mellitus.Mol Aspects Med. 2015 Apr;42:42-60. doi: 10.1016/j.mam.2014.12.004. Epub 2015 Jan 8. Mol Aspects Med. 2015. PMID: 25579746 Free PMC article. Review.
-
First-in-human, double-blind, randomized phase 1b study of peptide immunotherapy IMCY-0098 in new-onset type 1 diabetes: an exploratory analysis of immune biomarkers.BMC Med. 2024 Jun 21;22(1):259. doi: 10.1186/s12916-024-03476-y. BMC Med. 2024. PMID: 38902652 Free PMC article. Clinical Trial.
References
-
- Durinovic-Bello I, Boehm BO, Ziegler AG (2002) Predominantly recognized proinsulin T helper cell epitopes in individuals with and without islet cell autoimmunity. J Autoimmun 18(1): 55–66. - PubMed
-
- Durinovic-Bello I, Hummel M, Ziegler A-G (1996) Cellular immune response to diverse islet cell antigens in IDDM. Diabetes 45: 795–800. - PubMed
-
- Bennett ST, Lucassen AM, Gough SC, Powell EE, Undlien DE, et al. (1995) Susceptibility to human type 1 diabetes at IDDM2 is determined by tandem repeat variation at the insulin gene minisatellite locus. Nat Genet 9(3): 284–292. - PubMed
Publication types
MeSH terms
Substances
Grants and funding
LinkOut - more resources
Full Text Sources
Other Literature Sources
Medical
Molecular Biology Databases
Research Materials
