

External cys/cySS redox state modification controls the intracellular redox state and neurodegeneration via Akt in aging and Alzheimer's disease mouse model neurons
- PMID: 24844688
- PMCID: PMC6099062
- DOI: 10.3233/JAD-132756
External cys/cySS redox state modification controls the intracellular redox state and neurodegeneration via Akt in aging and Alzheimer's disease mouse model neurons
Abstract
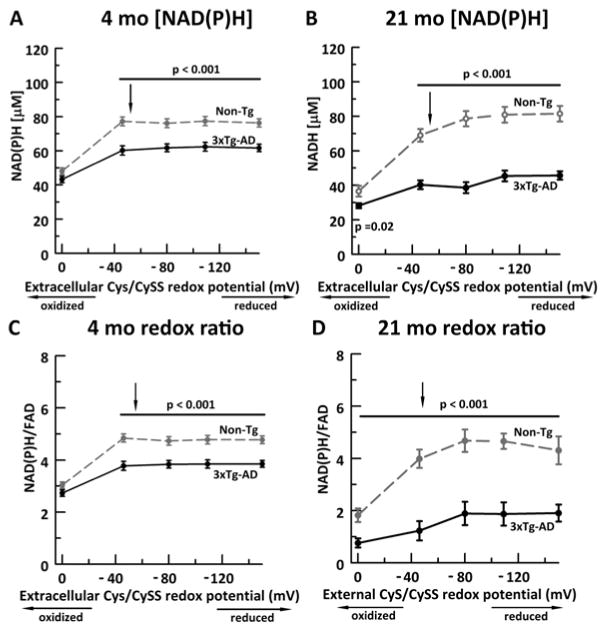
The extracellular redox environment of cells is mainly set by the redox couple cysteine/cystine (cys/cySS) while intracellular redox is buffered by reduced/oxidized glutathione (GSH/GSSG), but controlled by NAD(P)H/NAD(P). With aging, the extracellular redox environment shifts in the oxidized direction beyond middle-age. Since aging is the primary risk factor in Alzheimer's disease (AD), here our aim was to determine if a reduced extracellular cys/cySS redox potential of cultured primary mouse neurons changes the intracellular redox environment, affects pAkt levels, and protects against neuron loss. A reductive shift in cys/cySS in the extracellular medium of neuron cultures from young (4 month) and old (21 month) neurons from non-transgenic) and triple transgenic AD-like mice (3xTg-AD) caused an increase in intracellular NAD(P)H and GSH levels along with lower reactive oxygen species levels. Importantly, the imposed reductive shift decreased neuron death markedly in the 21 month neurons of both genotypes. Moreover, a reduced cys/cySS redox state increased the pAkt/Akt ratio in 21 month aging and AD-like neurons that positively correlated with a decreased neuron loss. Our findings demonstrate that manipulating the extracellular redox environment toward a more reduced redox potential is neuroprotective in both aging and AD-like neurons and may be a powerful and pragmatic therapeutic tool in aging and age-related diseases like AD.
Keywords: Aging; Akt; Alzheimer's disease; NAD(P)H; cys/cySS; glutathione; neurodegeneration.
Conflict of interest statement
No potential conflicts of interest exist for the authors.
Figures


Similar articles
-
Reversibility of Age-related Oxidized Free NADH Redox States in Alzheimer's Disease Neurons by Imposed External Cys/CySS Redox Shifts.Sci Rep. 2019 Aug 2;9(1):11274. doi: 10.1038/s41598-019-47582-x. Sci Rep. 2019. PMID: 31375701 Free PMC article.
-
Age-dependent oxidation of extracellular cysteine/cystine redox state (Eh(Cys/CySS)) in mouse lung fibroblasts is mediated by a decline in Slc7a11 expression.Free Radic Biol Med. 2018 Apr;118:13-22. doi: 10.1016/j.freeradbiomed.2018.02.026. Epub 2018 Feb 16. Free Radic Biol Med. 2018. PMID: 29458149 Free PMC article.
-
Oxidation of extracellular cysteine/cystine redox state in bleomycin-induced lung fibrosis.Am J Physiol Lung Cell Mol Physiol. 2009 Jan;296(1):L37-45. doi: 10.1152/ajplung.90401.2008. Epub 2008 Oct 17. Am J Physiol Lung Cell Mol Physiol. 2009. PMID: 18931052 Free PMC article.
-
Extracellular redox state: refining the definition of oxidative stress in aging.Rejuvenation Res. 2006 Summer;9(2):169-81. doi: 10.1089/rej.2006.9.169. Rejuvenation Res. 2006. PMID: 16706639 Review.
-
Cysteine/cystine redox signaling in cardiovascular disease.Free Radic Biol Med. 2011 Feb 15;50(4):495-509. doi: 10.1016/j.freeradbiomed.2010.11.029. Epub 2010 Dec 3. Free Radic Biol Med. 2011. PMID: 21130865 Free PMC article. Review.
Cited by
-
Thiol redox homeostasis in neurodegenerative disease.Redox Biol. 2015 Aug;5:186-194. doi: 10.1016/j.redox.2015.04.004. Epub 2015 Apr 22. Redox Biol. 2015. PMID: 25974624 Free PMC article. Review.
-
Cytoplasmic and Mitochondrial NADPH-Coupled Redox Systems in the Regulation of Aging.Nutrients. 2019 Feb 27;11(3):504. doi: 10.3390/nu11030504. Nutrients. 2019. PMID: 30818813 Free PMC article. Review.
-
ERp57 chaperon protein protects neuronal cells from Aβ-induced toxicity.J Neurochem. 2022 Aug;162(4):322-336. doi: 10.1111/jnc.15655. Epub 2022 Jul 8. J Neurochem. 2022. PMID: 35699375 Free PMC article.
-
Age-Related Oxidative Redox and Metabolic Changes Precede Intraneuronal Amyloid-β Accumulation and Plaque Deposition in a Transgenic Alzheimer's Disease Mouse Model.J Alzheimers Dis. 2022;90(4):1501-1521. doi: 10.3233/JAD-220824. J Alzheimers Dis. 2022. PMID: 36278355 Free PMC article.
-
The role of GZMA as a target of cysteine and biomarker in Alzheimer's disease, pelvic organ prolapse, and tumor progression.Front Pharmacol. 2024 Aug 20;15:1447605. doi: 10.3389/fphar.2024.1447605. eCollection 2024. Front Pharmacol. 2024. PMID: 39228516 Free PMC article.
References
-
- Jones DP. Disruption of mitochondrial redox circuitry in oxidative stress. Chem Biol Interact. 2006a;163:38–53. - PubMed
-
- Ying W. NAD+/NADH and NADP+/NADPH in cellular functions and cell death: regulation and biological consequences. Antiox Redox Signal. 2008;10:179–206. - PubMed
-
- Jones DP, Carlson JL, Mody VC, Cai J, Lynn MJ, Sternberg P. Redox state of glutathione in human plasma. Free Rad Biol Med. 2000;28:625–635. - PubMed
-
- Jones DP. Redox potential of GSH/GSSG couple: assay and biological significance. Meth Enzymol. 2002;348:93–112. - PubMed
Publication types
MeSH terms
Substances
Grants and funding
LinkOut - more resources
Full Text Sources
Other Literature Sources
Medical
