. 2014 Oct 1:99:301-11.
doi: 10.1016/j.neuroimage.2014.05.023. Epub 2014 May 17.

Validating the Why/How contrast for functional MRI studies of Theory of Mind

Affiliations

Validating the Why/How contrast for functional MRI studies of Theory of Mind

Robert P Spunt et al. Neuroimage. .

Abstract

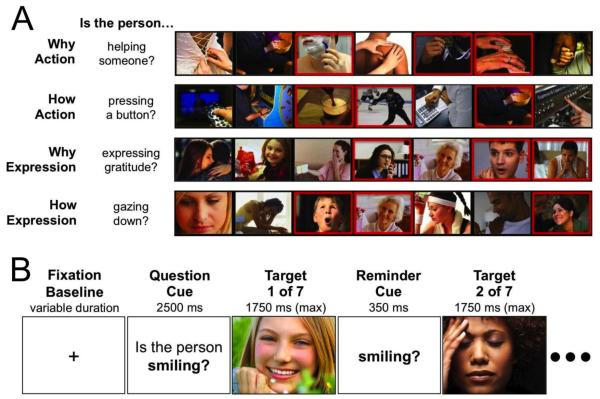
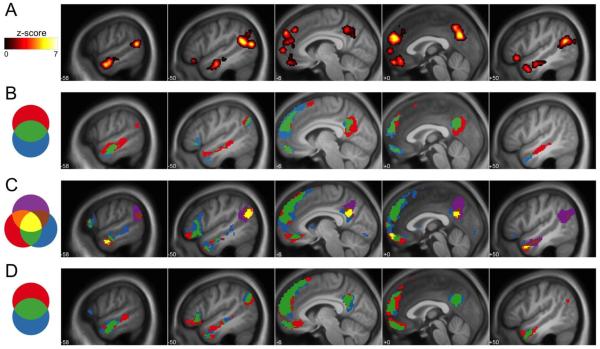
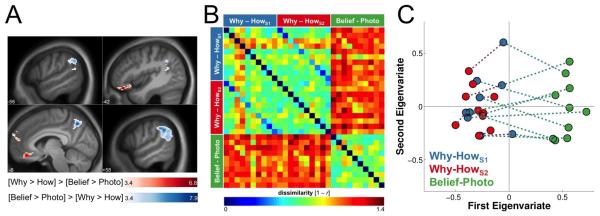
The ability to impute mental states to others, or Theory of Mind (ToM), has been the subject of hundreds of neuroimaging studies. Although reviews and meta-analyses of these studies have concluded that ToM recruits a coherent brain network, mounting evidence suggests that this network is an abstraction based on pooling data from numerous studies, most of which use different behavioral tasks to investigate ToM. Problematically, this means that no single behavioral task can be used to reliably measure ToM Network function as currently conceived. To make ToM Network function scientifically tractable, we need standardized tasks capable of reliably measuring specific aspects of its functioning. Here, our goal is to validate the Why/How Task for this purpose. Several prior studies have found that when compared to answering how-questions about another person's behavior, answering why-questions about that same behavior activates a network that is anatomically consistent with meta-analytic definitions of the ToM Network. In the version of the Why/How Task presented here, participants answer yes/no Why (e.g., Is the person helping someone?) and How (e.g., Is the person lifting something?) questions about pretested photographs of naturalistic human behaviors. Across three fMRI studies, we show that the task elicits reliable performance measurements and modulates a left-lateralized network that is consistently localized across studies. While this network is convergent with meta-analyses of ToM studies, it is largely distinct from the network identified by the widely used False-Belief Localizer, the most common ToM task. Our new task is publicly available, and can be used as an efficient functional localizer to provide reliable identification of single-subject responses in most regions of the network. Our results validate the Why/How Task, both as a standardized protocol capable of producing maximally comparable data across studies, and as a flexible foundation for programmatic research on the neurobiological foundations of a basic manifestation of human ToM.

Keywords: Action understanding; Attribution; False belief; Localizer; Mentalizing; Social cognition; Theory of Mind; fMRI.


Figures

Figure 1
Figure 1
Design of the Yes/No Why/How Task. (A) Examples of four blocks created by pairing either a question about motive (why) or implementation (how) with a set of photographs featuring either intentional actions or emotional expressions. Independently acquired normative data is used to ensure that every photo selected has an unambiguous (i.e., consensus) response. In the example blocks shown, the photographs outlined in red elicited a consensus response of `no', while the remaining photographs elicited a consensus response of `yes'. (B) Schematic showing the task timing. Each block begins with question presentation, and is followed by a set of photographs paired with that question. Between each photograph is a brief reminder of the question for that block. For each photograph, participants have 1750 ms to respond. If they fail to respond by that time, the task advances. Responding before the end of the 1750 ms ends the trial and advances to the next trial. Hence, block durations were contingent on response times. However, total task duration was not, as block onsets were fixed. As described in the main text, the versions of the Yes/No Why/How Task used in Studies 2 and 3 featured only trivial differences to what is presented here, which corresponds to the version used in Study 1.
Figure 2
Figure 2
Sagittal sections displaying (A) regions of the putative Theory-of-Mind (ToM) Network defined using the automated meta-analysis software Neurosynth (Yarkoni et al., 2011); (B) conjunction and disjunction of the top 10% activated voxels in the original (open-ended) implementation of the Why > How contrast (Blue; data from Spunt & Lieberman, 2012a, 2012b) and the new (yes/no) version of the Why > How contrast from Study 1 (Red); (C) conjunction and disjunction of the top 10% activated voxels for the comparisons described in Study 2, where: Red = Why > How Contrast (Study 1), Blue = Why > How Contrast (Study 2), and Purple = Belief > Photo Contrast (Study 2); and (D) conjunction and disjunction of the top 10% activated voxels in the Why/How contrast estimated on the full samples in Study 1 (N = 29; Blue) and Study 3 (N = 21; Red).
Figure 3
Figure 3
Univariate and multivariate similarity across tasks. (A) Comparison of the univariate (voxel-wise) responses to the two contrasts from Study 2 (N = 10; cluster-level corrected across the whole-brain). The prefrontal regions depicted with a red colormap showed a stronger response to the Why/How contrast, while the medial parietal and temporoparietal regions depicted with a blue colormap showed a stronger response to the Belief/Photo contrast. (B) Comparison of the multivariate (multivoxel) response patterns produced by the Why/How and Belief/Photo contrasts within the meta-analytically defined regions of the Theory-of-Mind Network shown in Figure 2a. This panel uses a representational dissimilarity matrix (RDM) to visualize the degree of pairwise dissimilarity among the response patterns produced by the three contrasts estimated for each of the ten participants: the Why/How contrast from Study 1 (rows/columns 1–10; Why/HowS1); the Why/How contrast from Study 2 (rows/columns 11–20; Why/HowS2); and the Belief/Photo contrast (rows/columns 21–30). The dissimilarity metric is 1 minus the Pearson correlation (r), where a value of 0 indicates perfect correlation; 1 indicates non-correlation; and 2 indicates perfect anti-correlation. Because the order of participants is constant across the three blocks of contrasts, the diagonals within each block represent within-subject pattern dissimilarities, while the off-diagonals represent between-subject dissimilarities. (C) A two-dimensional representation of the similarity structure based on multidimensional scaling applied to the RDM. Each colored circle represents a single contrast image, and constrast images for the same participant are connected by dashed colored lines. The length of these lines is the Euclidean distance between them, with longer lines representing more dissimilar multivariate patterns.

References

    1. Apperly I. What is “theory of mind”? Concepts, cognitive processes and individual differences. Q J Exp Psychol. 2012;65(5):825–839. doi:10.1080/17470218.2012.676055. - PubMed
    1. Ashburner J. A fast diffeomorphic image registration algorithm. Neuroimage. 2007;38(1):95–113. doi:10.1016/j.neuroimage.2007.07.007. - PubMed
    1. Brainard DH. The psychophysics toolbox. Spatial Vision. 1997;10(4):433–436. doi:10.1163/156856897X00357. - PubMed
    1. Campbell DT. Recommendations for apa test standards regarding construct, trait, or discriminant validity. Am Psychol. 1960;15(8):546.
    1. Campbell DT, Fiske DW. Convergent and discriminant validation by the multitraitmultimethod matrix. Psychol Bulletin. 1959;56(2):81. - PubMed

Publication types