Comparative Study
. 2015 Feb;22(2):165-72.
doi: 10.1177/1933719114536472. Epub 2014 May 20.

Behavior of tumor necrosis factor-α and tumor necrosis factor receptor 1/tumor necrosis factor receptor 2 system in mononuclear cells recovered from peritoneal fluid of women with endometriosis at different stages

Affiliations
Comparative Study

Behavior of tumor necrosis factor-α and tumor necrosis factor receptor 1/tumor necrosis factor receptor 2 system in mononuclear cells recovered from peritoneal fluid of women with endometriosis at different stages

Francesca M Salmeri et al. Reprod Sci. 2015 Feb.

Abstract

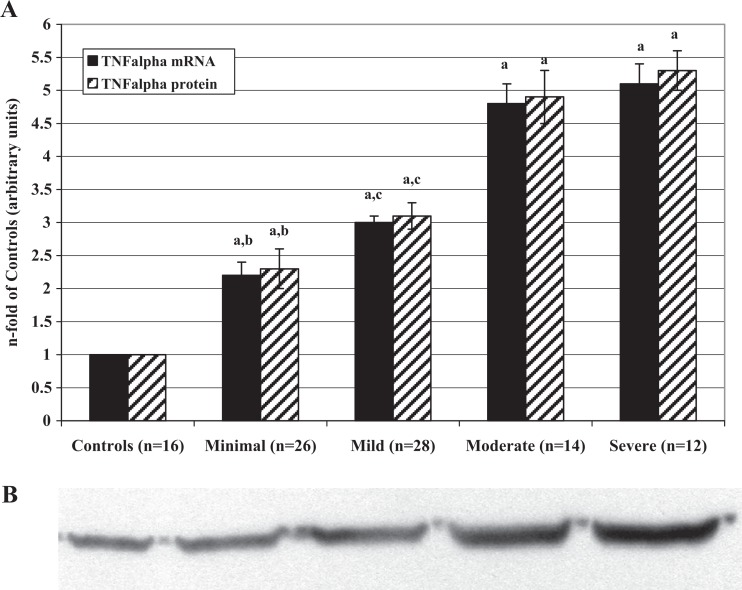
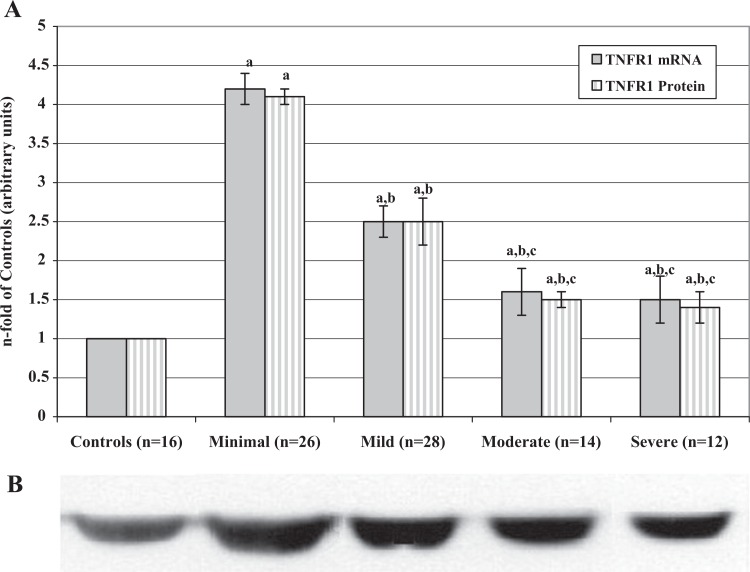
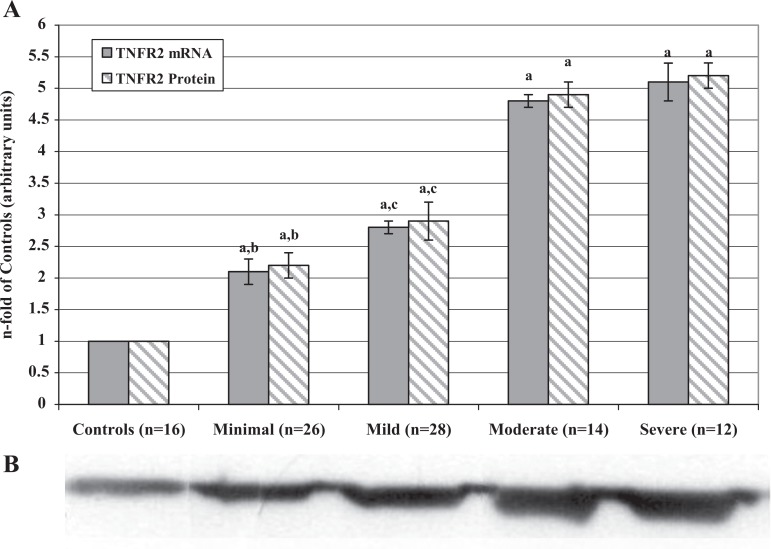
During endometriosis, a breakdown occurs in endometrial and peritoneal homeostasis caused by cytokine-induced cell proliferation and dysregulation of apoptosis. We studied tumor necrosis factor (TNF)-α, TNF receptor (TNFR) 1, and TNFR2 gene expression at both messenger RNA (mRNA) and protein levels in peritoneal fluid (PF) mononuclear cells (PFMCs), the percentages of these cells bearing the same markers, and soluble TNF-α (sTNF-α) values in PF of 80 women with endometriosis. We found that TNFR1 mRNA and protein levels, the percentages of TNFR1-bearing PFMCs, and sTNF-α values decreased from minimal to severe stages of the disease. Instead, TNF-α and TNFR2 mRNA and protein levels, the percentages of membrane TNF-α (mTNF-α)- and TNFR2-bearing PFMCs increased as the disease worsened. These data allow us to hypothesize that, in early stages, the high percentages of TNFR1-bearing PFMCs and the high levels of sTNF-α could address signal toward complex I pathway, favoring the inflammatory response. With the worsening of the disease, the low percentages of TNFR1-bearing PFMCs are probably due to decreased TNFR1 mRNA transcription and protein translation rate. In early stages (minimal and mild), the percentages of both TNFR2- and mTNF-α-bearing PFMCs are so low, due to decreased mRNA transcription and protein translation rate, that subsequent cellular events may depend minimally by this interaction. The high levels of sTNF-α may be rerouted to bind TNFR1. In contrast, in the moderate and severe stages, the high percentages of TNFR2-bearing PFMCs may be saturated by high percentages of mTNF-α-bearing PFMCs, triggering death process. So, in endometriosis, each component of the TNF-α/TNFRs system may trigger opposite cellular fate.

Keywords: PFMCs; TNF-α; TNFR1; TNFR2; endometriosis.


Conflict of interest statement

Declaration of Conflicting Interests: The author(s) declared no potential conflicts of interest with respect to the research, authorship, and/or publication of this article.

Figures

Figure 1.
Figure 1.
A, Levels of tumor necrosis factor-α mRNA and protein in PFMCs of women with and without endometriosis (controls). RNAs were extracted from isolated PFMCs and subjected to RT-PCR. The resulting cDNAs were then assayed by RT-PCR to determine expression of FasL as described in the text. Proteins were extracted from PFMC lysates and analyzed by Western blot using the antibodies against TNF-α. Values are the mean ± SD of n patients and are expressed as the n-fold increase in mRNA and protein levels in the stages of endometriosis with respect to the controls. Each sample was assessed in triplicate. The control group bar is set to 1. a P < .001 all the stages of endometriosis versus controls; b P < .001 minimal versus mild, moderate, and severe endometriosis; c P < .001 mild versus moderate and severe endometriosis. B, Representative Western blot image of the TNF-α proteins measured in PFMCs of women with and without endometriosis (controls). mRNA indicates messenger RNA; PFMCs, peritoneal fluid mononuclear cells; RT-PCR, real-time quantitative polymerase chain reaction; cDNA, complementary DNA; TNF-α, tumor necrosis factor α; SD, standard deviation.
Figure 2.
Figure 2.
A, Tumor necrosis factor receptor 1 mRNA and protein levels in PFMCs of women with and without endometriosis. RNAs were extracted from isolated PFMCs and subjected to RT-PCR. The resulting cDNAs were then assayed by real-time quantitative PCR to determine expression of TNFR1 as described in the text. Proteins were extracted from PFMC lysates and analyzed by Western blot using the antibodies against TNFR1. Values are the mean ± SD of n patients and are expressed as the n-fold increase in mRNA and protein levels in the stages of endometriosis with respect to the controls. Each sample was assessed in triplicate. The control group bar is set to 1. a P < .001 all the stages of endometriosis versus controls; b P < .001 mild, moderate, and severe versus minimal endometriosis; c P < .001 moderate and severe versus mild endometriosis. B, Representative Western blot image of the TNFR1 proteins measured in PFMCs of women with and without endometriosis (controls). TNFR1 indicates tumor necrosis factor receptor 1; mRNA, messenger RNA; PFMCs, peritoneal fluid mononuclear cells; RT-PCR, real-time quantitative polymerase chain reaction; SD, standard deviation.
Figure 3.
Figure 3.
A, Tumor necrosis factor receptor 2 mRNA and protein levels in PFMCs of women with and without endometriosis. RNAs were extracted from isolated PFMCs and subjected to RT-PCR. The resulting cDNAs were then assayed by real-time quantitative PCR to determine expression of TNFR2 as described in the text. Proteins were extracted from PFMC lysates and analyzed by Western blot using the antibodies against TNFR2. Values are the mean ± SD of n patients and are expressed as the n-fold increase in mRNA and protein levels in the stages of endometriosis with respect to the controls. Each sample was assessed in triplicate. The control group bar is set to 1. a P < .001 all the stages of endometriosis versus controls; b P < .001 minimal versus mild, moderate, and severe endometriosis; c P < .001 mild versus moderate and severe endometriosis. B, Representative Western blot image of the TNFR2 proteins measured in PFMCs of women with and without endometriosis (controls). TNFR2 indicates tumor necrosis factor receptor 2; mRNA, messenger RNA; PFMCs, peritoneal fluid mononuclear cells; RT-PCR, real-time quantitative polymerase chain reaction; SD, standard deviation.

References

    1. Bulun SE, Gurates B, Fang Z, et al. Mechanisms of excessive estrogen formation in endometriosis. J Reprod Immunol. 2002;55(1-2):21–33. - PubMed
    1. Baldi A, Campioni N, Signorile PG. Endometriosis: pathogenesis, diagnosis, therapy and association with cancer. Oncol Rep. 2008;19(4):843–846. - PubMed
    1. Bulun SE. Endometriosis. N Engl J Med. 2009;360(3):268–279. - PubMed
    1. Arici A, Oral E, Attar E, Tazuke SI, Olive DL. Monocyte chemotactic protein-1 concentration in peritoneal fluid of women with endometriosis and its modulation of expression in mesothelial cells. Fertil Steril. 1997;67(6):1065–1072. - PubMed
    1. Braun DP, Ding J, Shen J, Rana N, Fernandez BB, Dmowski WP. Relationship between apoptosis and the number of macrophages in eutopic endometrium from women with and without endometriosis. Fertil Steril. 2002;78(4):830–835. - PubMed

Publication types

MeSH terms

Substances