

Computed tomography (CT) perfusion as an early predictive marker for treatment response to neoadjuvant chemotherapy in gastroesophageal junction cancer and gastric cancer--a prospective study
- PMID: 24845062
- PMCID: PMC4028233
- DOI: 10.1371/journal.pone.0097605
Computed tomography (CT) perfusion as an early predictive marker for treatment response to neoadjuvant chemotherapy in gastroesophageal junction cancer and gastric cancer--a prospective study
Abstract
Objectives: To evaluate whether early reductions in CT perfusion parameters predict response to pre-operative chemotherapy prior to surgery for gastroesophageal junction (GEJ) and gastric cancer.
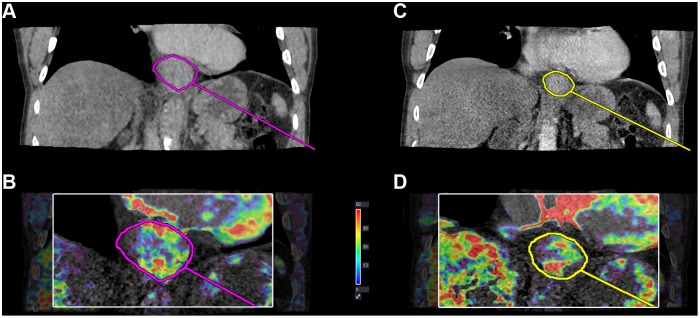
Materials and methods: Twenty-eight patients with adenocarcinoma of the gastro-esophageal junction (GEJ) and stomach were included. Patients received three series of chemotherapy before surgery, each consisting of a 3-week cycle of intravenous epirubicin, cisplatin or oxaliplatin, concomitant with capecitabine peroral. The patients were evaluated with a CT perfusion scan prior to, after the first series of, and after three series of chemotherapy. The CT perfusion scans were performed using a 320-detector row scanner. Tumour volume and perfusion parameters (arterial flow, blood volume and permeability) were computed on a dedicated workstation with a consensus between two radiologists. Response to chemotherapy was evaluated by two measures. Clinical response was defined as a tumour size reduction of more than 50%. Histological response was evaluated based on residual tumour cells in the surgical specimen using the standardized Mandard Score 1 to 5, in which values of 1 and 2 were classified as responders, and 3 to 5 were classified as nonresponders.
Results: A decrease in tumour permeability after one series of chemotherapy was positively correlated with clinical response after three series of chemotherapy. Significant changes in permeability and tumour volume were apparent after three series of chemotherapy in both clinical and histological responders. A cut-off value of more than 25% reduction in tumour permeability yielded a sensitivity of 69% and a specificity of 58% for predicting clinical response.
Conclusion: Early decrease in permeability is correlated with the likelihood of clinical response to pre-operative chemotherapy in GEJ and gastric cancer. As a single diagnostic test, CT Perfusion only has moderate sensitivity and specificity in response assessment of pre-operative chemotherapy making it insufficient for clinical decision purposes.
Conflict of interest statement
Figures


Similar articles
-
An application study of low-dose computed tomography perfusion imaging for evaluation of the efficacy of neoadjuvant chemotherapy for advanced gastric adenocarcinoma.Gastric Cancer. 2018 May;21(3):413-420. doi: 10.1007/s10120-017-0763-0. Epub 2017 Sep 4. Gastric Cancer. 2018. PMID: 28871423 Clinical Trial.
-
Sequential FDG-PET and induction chemotherapy in locally advanced adenocarcinoma of the Oesophago-gastric junction (AEG): the Heidelberg Imaging program in Cancer of the oesophago-gastric junction during Neoadjuvant treatment: HICON trial.BMC Cancer. 2011 Jun 24;11:266. doi: 10.1186/1471-2407-11-266. BMC Cancer. 2011. PMID: 21702914 Free PMC article.
-
Contrast-enhanced ultrasonography assessment of gastric cancer response to neoadjuvant chemotherapy.World J Gastroenterol. 2012 Dec 21;18(47):7026-32. doi: 10.3748/wjg.v18.i47.7026. World J Gastroenterol. 2012. PMID: 23323004 Free PMC article.
-
Metabolic response evaluation by PET during neoadjuvant treatment for adenocarcinoma of the esophagus and esophagogastric junction.Recent Results Cancer Res. 2010;182:167-77. doi: 10.1007/978-3-540-70579-6_14. Recent Results Cancer Res. 2010. PMID: 20676880 Review.
-
Computed tomography of the gastroesophageal junction.Crit Rev Diagn Imaging. 1984;21(3):183-228. Crit Rev Diagn Imaging. 1984. PMID: 6375968 Review.
Cited by
-
A Systematic Review on the Role of the Perfusion Computed Tomography in Abdominal Cancer.Dose Response. 2021 Nov 24;19(4):15593258211056199. doi: 10.1177/15593258211056199. eCollection 2021 Oct-Dec. Dose Response. 2021. PMID: 34880716 Free PMC article. Review.
-
An application study of low-dose computed tomography perfusion imaging for evaluation of the efficacy of neoadjuvant chemotherapy for advanced gastric adenocarcinoma.Gastric Cancer. 2018 May;21(3):413-420. doi: 10.1007/s10120-017-0763-0. Epub 2017 Sep 4. Gastric Cancer. 2018. PMID: 28871423 Clinical Trial.
-
Computed tomography-based radiomics for prediction of neoadjuvant chemotherapy outcomes in locally advanced gastric cancer: A pilot study.Chin J Cancer Res. 2018 Aug;30(4):406-414. doi: 10.21147/j.issn.1000-9604.2018.04.03. Chin J Cancer Res. 2018. PMID: 30210220 Free PMC article.
-
Evaluation of 18F-fluorothymidine positron emission tomography ([18F]FLT-PET/CT) methodology in assessing early response to chemotherapy in patients with gastro-oesophageal cancer.EJNMMI Res. 2016 Dec;6(1):81. doi: 10.1186/s13550-016-0234-3. Epub 2016 Nov 16. EJNMMI Res. 2016. PMID: 27854031 Free PMC article.
-
Imaging strategies in the management of gastric cancer: current role and future potential of MRI.Br J Radiol. 2019 May;92(1097):20181044. doi: 10.1259/bjr.20181044. Epub 2019 Mar 5. Br J Radiol. 2019. PMID: 30789792 Free PMC article. Review.
References
-
- Hayano K, Okazumi S, Shuto K, Matsubara H, Shimada H, et al. (2007) Perfusion CT can predict the response to chemoradiation therapy and survival in esophageal squamous cell carcinoma: Initial clinical results. Oncology Reports 18: 901–908. - PubMed
-
- Koyasu S, Isoda H, Tsuji Y, Yamamoto H, Matsueda K, et al. (2012) Hepatic arterial perfusion increases in the early stage of severe acute pancreatitis patients: evaluation by perfusion computed tomography. Eur J Radiol 81: 43–46. - PubMed
-
- Jiang T, Kambadakone A, Kulkarni NM, Zhu AX, Sahani DV (2012) Monitoring response to antiangiogenic treatment and predicting outcomes in advanced hepatocellular carcinoma using image biomarkers, CT perfusion, tumor density, and tumor size (RECIST). Invest Radiol 47: 11–17. - PubMed
-
- Fournier LS, Oudard S, Thiam R, Trinquart L, Banu E, et al. (2010) Metastatic Renal Carcinoma: Evaluation of Antiangiogenic Therapy with Dynamic Contrast-enhanced CT1. Radiology 256: 511–518. - PubMed
Publication types
MeSH terms
Substances
LinkOut - more resources
Full Text Sources
Other Literature Sources
Medical
Research Materials
