

Normal fibroblasts induce E-cadherin loss and increase lymph node metastasis in gastric cancer
- PMID: 24845259
- PMCID: PMC4028202
- DOI: 10.1371/journal.pone.0097306
Normal fibroblasts induce E-cadherin loss and increase lymph node metastasis in gastric cancer
Abstract
Background: A tumor is considered a heterogeneous complex in a three-dimensional environment that is flush with pathophysiological and biomechanical signals. Cell-stroma interactions guide the development and generation of tumors. Here, we evaluate the contributions of normal fibroblasts to gastric cancer.
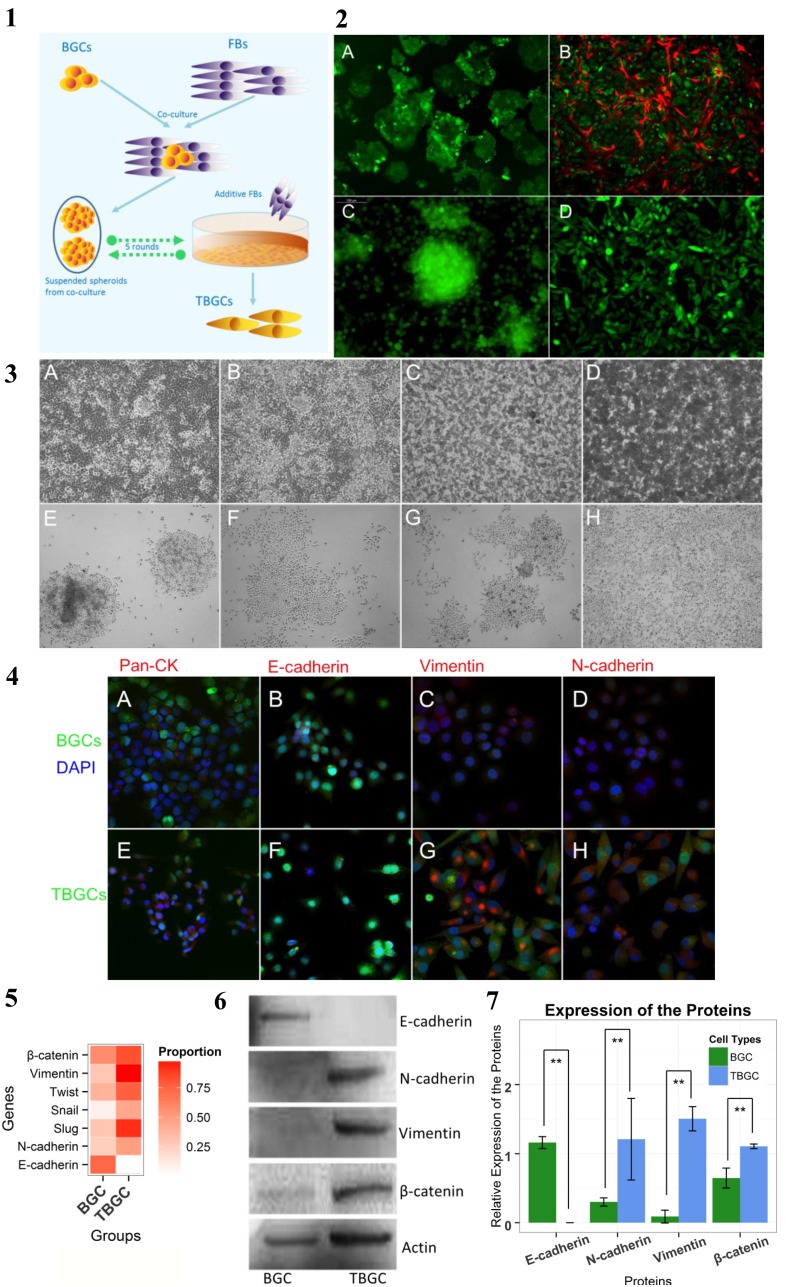
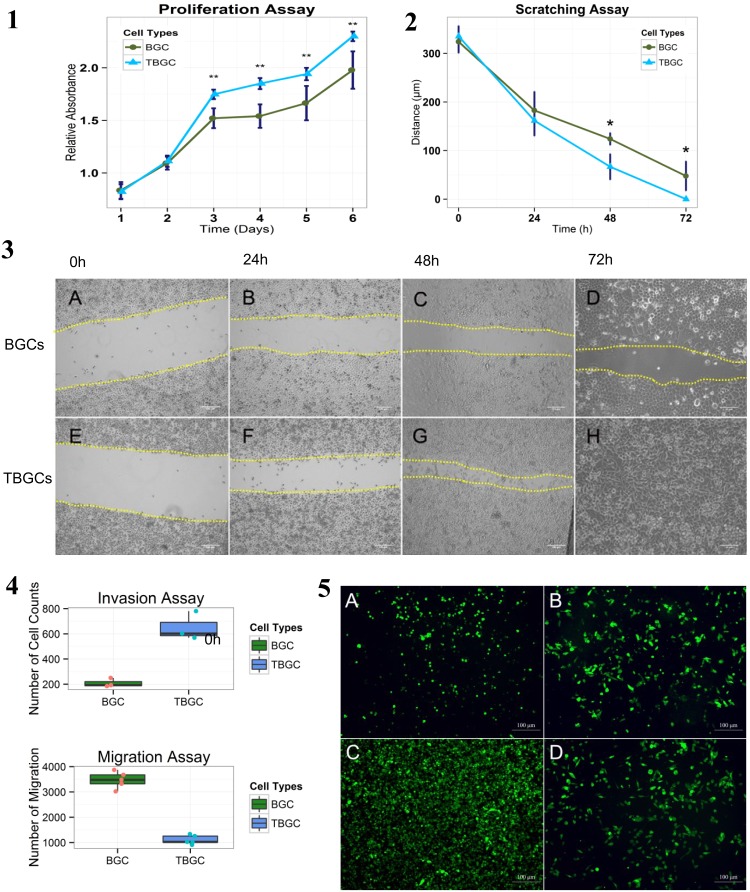
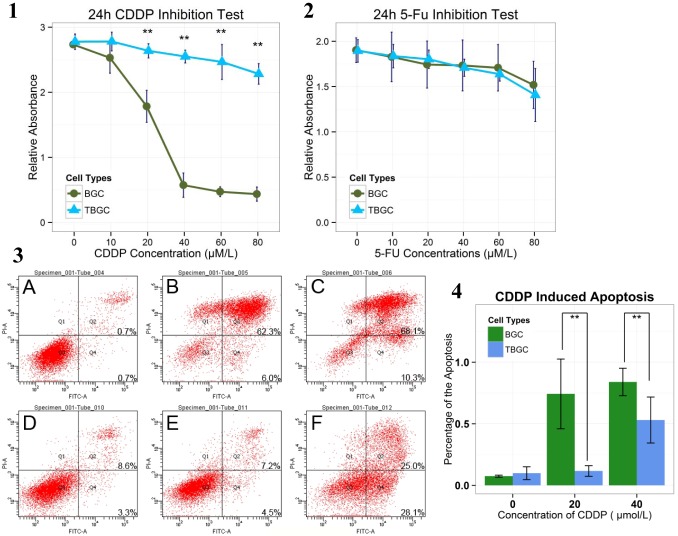
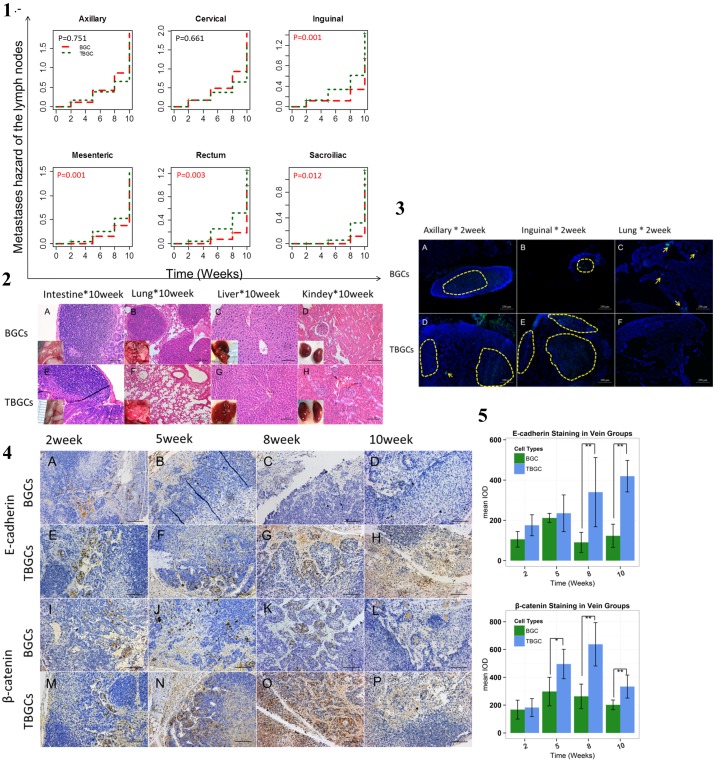
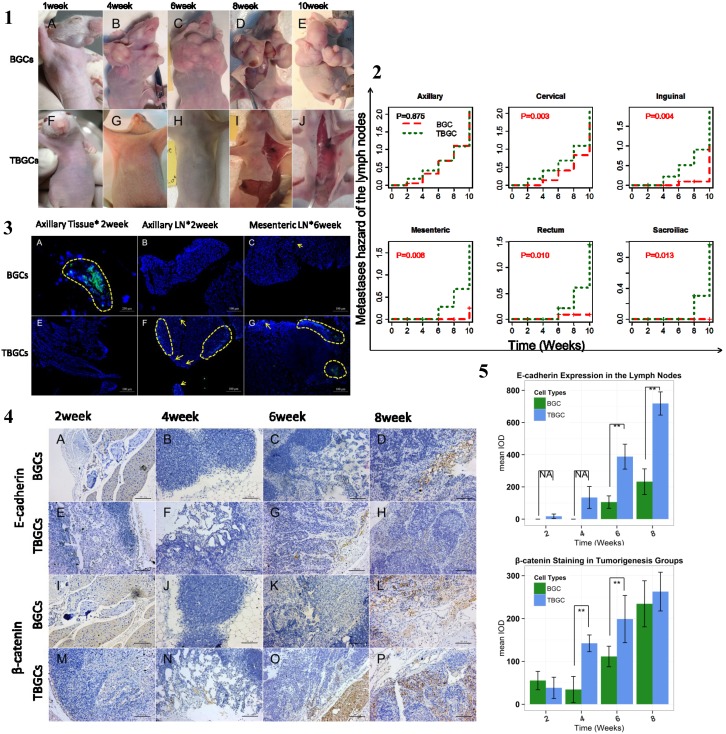
Methodology/principal findings: By coculturing normal fibroblasts in monolayers of BGC-823 gastric cancer cells, tumor cells sporadically developed short, spindle-like morphological characteristics and demonstrated enhanced proliferation and invasive potential. Furthermore, the transformed tumor cells demonstrated decreased tumor formation and increased lymphomatic and intestinal metastatic potential. Non-transformed BGC-823 cells, in contrast, demonstrated primary tumor formation and delayed intestinal and lymph node invasion. We also observed E-cadherin loss and the upregulation of vimentin expression in the transformed tumor cells, which suggested that the increase in metastasis was induced by epithelial-to-mesenchymal transition.
Conclusion: Collectively, our data indicated that normal fibroblasts sufficiently induce epithelial-to-mesenchymal transition in cancer cells, thereby leading to metastasis.
Conflict of interest statement
Figures
Similar articles
-
Clinical significance of altering epithelial-mesenchymal transition in metastatic lymph nodes of gastric cancer.Gastric Cancer. 2017 Sep;20(5):802-810. doi: 10.1007/s10120-017-0705-x. Epub 2017 Feb 28. Gastric Cancer. 2017. PMID: 28247164
-
CEACAM6 promotes gastric cancer invasion and metastasis by inducing epithelial-mesenchymal transition via PI3K/AKT signaling pathway.PLoS One. 2014 Nov 14;9(11):e112908. doi: 10.1371/journal.pone.0112908. eCollection 2014. PLoS One. 2014. PMID: 25398131 Free PMC article.
-
[Expression of epithelial cadherin in early gastric cancer and its correlation to lymph node micrometastasis and clinicopathologic features].Ai Zheng. 2007 May;26(5):541-6. Ai Zheng. 2007. PMID: 17672949 Chinese.
-
Combination of epithelial-mesenchymal transition and cancer stem cell-like phenotypes has independent prognostic value in gastric cancer.Hum Pathol. 2012 Apr;43(4):520-8. doi: 10.1016/j.humpath.2011.07.003. Epub 2011 Oct 21. Hum Pathol. 2012. PMID: 22018628
-
Overexpression of EphA2 correlates with epithelial-mesenchymal transition-related proteins in gastric cancer and their prognostic importance for postoperative patients.Med Oncol. 2012 Dec;29(4):2691-700. doi: 10.1007/s12032-011-0127-2. Epub 2011 Dec 22. Med Oncol. 2012. PMID: 22189617
Cited by
-
Fibroblasts as Turned Agents in Cancer Progression.Cancers (Basel). 2023 Mar 28;15(7):2014. doi: 10.3390/cancers15072014. Cancers (Basel). 2023. PMID: 37046676 Free PMC article. Review.
-
Tumor-Associated Macrophages and Inflammatory Microenvironment in Gastric Cancer: Novel Translational Implications.Int J Mol Sci. 2021 Apr 7;22(8):3805. doi: 10.3390/ijms22083805. Int J Mol Sci. 2021. PMID: 33916915 Free PMC article. Review.
-
Long non-coding RNA LINC01314 represses cell migration, invasion, and angiogenesis in gastric cancer via the Wnt/β-catenin signaling pathway by down-regulating KLK4.Cancer Cell Int. 2019 Apr 11;19:94. doi: 10.1186/s12935-019-0799-9. eCollection 2019. Cancer Cell Int. 2019. PMID: 31007611 Free PMC article.
-
Homophilic and heterophilic cadherin bond rupture forces in homo- or hetero-cellular systems measured by AFM-based single-cell force spectroscopy.Eur Biophys J. 2021 May;50(3-4):543-559. doi: 10.1007/s00249-021-01536-2. Epub 2021 Apr 20. Eur Biophys J. 2021. PMID: 33880610 Free PMC article.
-
ER-α36 mediates gastric cancer cell invasion.Int J Clin Exp Pathol. 2020 Jul 1;13(7):1550-1559. eCollection 2020. Int J Clin Exp Pathol. 2020. PMID: 32782673 Free PMC article.
References
-
- Udagawa T, Wood M (2010) Tumor-stromal cell interactions and opportunities for therapeutic intervention. Curr Opin Pharmacol 10: 369–374. - PubMed
-
- Martz E, Steinberg MS (1972) The role of cell-cell contact in “contact” inhibition of cell division: a review and new evidence. Journal of cellular physiology 79: 189–210. - PubMed
-
- Orimo A, Gupta PB, Sgroi DC, Arenzana-Seisdedos F, Delaunay T, et al. (2005) Stromal fibroblasts present in invasive human breast carcinomas promote tumor growth and angiogenesis through elevated SDF-1/CXCL12 secretion. Cell 121: 335–348. - PubMed
Publication types
MeSH terms
Substances
LinkOut - more resources
Full Text Sources
Other Literature Sources
Medical
