. 2014 Jul:37:15-24.
doi: 10.1016/j.matbio.2014.05.004. Epub 2014 May 16.

Members of the thrombospondin gene family bind stromal interaction molecule 1 and regulate calcium channel activity

Affiliations

Members of the thrombospondin gene family bind stromal interaction molecule 1 and regulate calcium channel activity

Mark Duquette et al. Matrix Biol. 2014 Jul.

Abstract

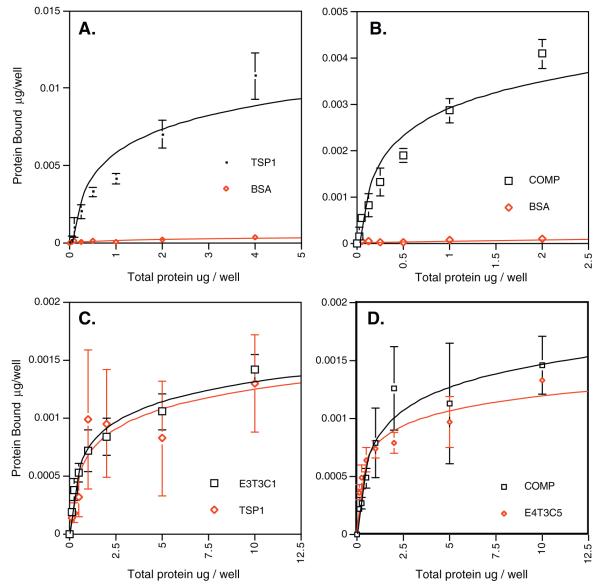
The thrombospondins (TSPs) are a family of matricellular proteins that regulate cellular phenotype through interactions with a myriad of other proteins and proteoglycans. We have identified a novel interaction of the members of the TSP gene family with stromal interaction molecule 1 (STIM1). This association is robust since it is preserved in Triton X-100, can be detected with multiple anti-TSP-1 and anti-STIM1 antibodies, and is detected in a wide range of cell types. We have also found that STIM1 co-immunoprecipitates with TSP-4 and cartilage oligomeric matrix protein (COMP), and that a recombinant version of the N-terminal domain of STIM1 binds to the signature domain of TSP-1 and COMP. The association of the TSPs with STIM1 is observed in both the presence and absence of calcium indicating that the calcium-dependent conformation of the signature domain of TSPs is not required for binding. Thus, this interaction could occur in the ER under conditions of normal or low calcium concentration. Furthermore, we observed that the expression of COMP in HEK 293 cells decreases STIM1-mediated calcium release activated calcium (CRAC) channel currents and increases arachidonic acid calcium (ARC) channel currents. These data indicate that the TSPs regulate STIM1 function and participate in the reciprocal regulation of two channels that mediate calcium entry into the cell.

Keywords: Arachidonate-regulated calcium channel; Calcium signaling; Stromal interaction molecule 1; Thrombospondin.


Figures

Fig. 1
Fig. 1
STIM1 associates with TSP-1. A. Triton X-100 extracts of human blood platelets were immunoprecipitated with the anti-TSP-1 polyclonal antibody (R1, lanes 2, 4 and 6) or pre-immune serum (lanes 1,3 and 5) in the presence of EDTA (lanes 1 and 2), calcium (lanes 3 and 4), or calcium with the calpain inhibitor ALLN (lanes 5 and 6). STIM1 was detected in the immunoprecipitates with an anti-STIM1 monoclonal antibody (clone 44). B. Triton X-100 extracts of human blood platelets were immunoprecipitated with the anti-STIM1 monoclonal (clone 5A2, lane 3) or isotype matched non-immune IgG (lane 1). The platelet lysate is shown in lane 5, and lanes 2 and 4 are empty. TSP-1 was detected in the immunoprecipitates with the anti-TSP-1 polyclonal antibody R3. C. Triton X-100 extracts of Jurkat cells were immunoprecipitated with the anti-TSP-1 polyclonal antibody (R1, lane 2) or pre-immune serum (lane 1) in the presence of EDTA and blotted for STIM1. The cell lysate is shown in lane 4, and lane 3 is empty. D. Triton X-100 extracts of Jurkat cells were immunoprecipitated with the anti-TSP-1 polyclonal antibody (R1, lane 2) or pre-immune serum (lane 1) in the presence of EDTA and blotted for STIM2. E. Triton X-100 extracts of endothelial cells (lane 3) were immunoprecipitated with the anti-TSP-1 polyclonal antibody (R1, lane 2) or pre-immune serum (lane 1) in the presence of EDTA and blotted for STIM1. F. Triton X-100 extracts of MDA-MB-231 cells were immunoprecipitated with the anti-TSP-1 polyclonal antibody (R1, lane 2) or pre-immune serum (lane 1) in the presence of EDTA and blotted for STIM1. The incubation with pre-immune serum and R1 was also done with intact MDA-MB-231 cells prior to solubilization. The cells were then washed, solubilized and immunocomplexes were brought down with Protein A Sepharose beads. The pre-immune sample (lane 3), R1 sample (lane 4) and cell lysate (lane 5) were blotted for STIM1. The pre-immune sample (lane 6), the R1 sample (lane 7) and the lysate (lane 8) were also blotted for TSP-1 to establish the presence of membrane associated TSP-1.
Fig. 2
Fig. 2
STIM1 associates with TSP-4 and COMP. A. Triton X-100 solubilized 293 cells engineered to express human TSP-4 were immunoprecipitated with the anti-TSP-4 polyclonal antibody (designated 1259, lane 2) or pre-immune serum (lane 1) and blotted for STIM1. B. Triton X-100 extracts of 293 cells engineered to express human COMP (lanes 1 and 2), or primary human costochondral chondrocytes (lane 3) were immunoprecipitated with the anti-COMP polyclonal antibody (designated F8, lanes 2 and 3) or pre-immune serum (lane 1) and blotted for STIM1. The cell lysates for the primary human costrochondral chondrocytes (lane 4) are also shown. C. Lysates of 293 cells transfected with empty vector (control) or the human COMP expression vector (+COMP) were blotted for COMP and β-actin as indicated. D. Lysates of 293 cells transfected with empty vector (control) or the human COMP expression vector (+COMP) were blotted for STIM1 and β-actin as indicated. E. Lysates of 293 cells transfected with empty vector (control) or the human Orai1 expression vector (+Orai1) were blotted for STIM1 and β-actin as indicated.
Fig. 3
Fig. 3
Limited chymotryptic digestion of a recombinant version of the N-terminal domain of STIM1 with varying concentrations of calcium. A purified recombinant N-terminal domain of STIM1 was dialyzed against Tris-buffered saline containing 2 mM CaCl2 (lane 1). EDTA was added to each sample so that the final Ca2+ concentrations would be between 2 mM and 0.01 mM (lanes 2 through 9, as indicated below each lane) along with chymotryptic digestion, which was carried out at an enzyme/substrate ratio of 1:500 (w/w) for 20 h at 0 °C. The digestion was halted with the addition of a reduced SDS sample buffer. The polypeptides were separated using SDS-PAGE. The relative quantity of the 22,000-dalton polypeptide was shown above the lanes with the 2 mM sample estimated at 1.0. Proteolytic fragments were visualized by staining with Coomassie Blue. The molecular mass of the markers (M) is marked on the left.
Fig. 4
Fig. 4
Binding of the N-terminal domain of STIM1 to TSPs. A. Human platelet TSP-1 and BSA were adsorbed by the wells of an Immulon II plate overnight in 2 mM CaCl2. Fluorescently labeled, recombinant N-terminal domain of STIM1 was incubated in the wells overnight in 2 mM CaCl2. B. Recombinant COMP and BSA were adsorbed to the wells of an Immulon II plate overnight in 2 mM CaCl2. The fluorescently labeled, recombinant N-terminal domain of STIM1 was incubated in the wells overnight in 2 mM CaCl2. C. Human platelet TSP-1 and E3T3C1 were adsorbed by the wells of a FluoroNunc Maxisorb plate overnight in the presence of 5 mM EDTA. Fluorescently labeled, recombinant N-terminal domain of STIM1 was incubated in the wells overnight in 5 mM EDTA. D. Human recombinant COMP and E4T3C5 were adsorbed by the wells of a FluoroNunc Maxisorb plate overnight in the presence of 5 mM EDTA. The fluorescently labeled, recombinant N-terminal domain of STIM1 was incubated in the wells overnight in 5 mM EDTA. In all cases, the wells were washed, and the bound protein then was quantified using a fluorescent plate reader. Each point shown is the mean and standard deviation of four determinations.
Fig. 5
Fig. 5
Expression of COMP increases calcium influx induced by thapsigargin. A. Control transfected HEK 293 cells (blue line) and COMP expressing HEK 293 cells (red line) were loaded with Fura-2 and treated with 2 μM thapsigargin. After 300 s, 1.8 mM CaCl2 was added to the sample and the fluorescence was monitored for an additional 300 s. B. To concurrently measure cellular calcium at multiple concentrations of exogenous calcium, control transfected HEK cells (black lines) and COMP expressing HEK 293 (green lines) were loaded with Fluo-4NW and 2.5 mM Probenecid. Thapsigargin (2 μM, black squares and green triangles) or an equal volume of Ca2+-free HBSS (black and green circles) was then added to each well, incubated for 10 min at room temperature and then placed in a Flipr plate reader. Ca2+ dose–response data was generated by adding external Ca2+ to each well to final concentrations of 20 μM to 5 mM. The wells with no Ca2+ added were considered baseline. Each Ca2+ dose was replicated in 4 wells. External Ca2+ was added by the Flipr. The arbitrary fluorescent units were normalized to baseline and reported as F/Fo where F = fluorescence and Fo = mean fluorescence for the first 5 time points. F/Fo versus time curves were generated and the store-operated Ca2+ (SOC) response estimated by calculating the area under the curve (AUC).
Fig. 6
Fig. 6
Measurement of CRAC and ARC channel currents in the presence and absence of COMP. CRAC channel currents (top left) induced by depletion of ER Ca2+ stores and ARC channel currents (top right) induced by bath addition of arachidonic acid (8 μM) in control transfected (black circles) and COMP expressing HEK 293 cells (red circles) were measured by patch-clamp as previously described in Materials and methods. For arachidonic acid-activated ARC channel current measurements, the initial currents obtained before activation of the channel were used for leak subtraction. For store-operated CRAC channel measurements, the pipette solution was changed to a Ca2+-free solution containing the potent InsP3 receptor agonist adenophostin A (2 μM), and leak-subtraction of the measured currents was obtained at the end of each experiment by application of an external solution containing La3+ (100 μM).
Fig. 7
Fig. 7
Measurement of CRAC and ARC channel currents in the presence and absence of COMP in Orai1-over-expressing cells. CRAC channel currents (top left) induced by depletion of ER Ca2+ stores and ARC channel currents (top right) induced by bath addition of arachidonic acid (8 μM) in control transfected (black circles) and COMP expressing HEK 293 cells (red circles) were measured by patch-clamp as previously described in Materials and methods. For arachidonic acid-activated ARC channel current measurements, the initial currents obtained before activation of the channel were used for leak subtraction. For store-operated CRAC channel measurements, the pipette solution was changed to a Ca2+-free solution containing the potent InsP3 receptor agonist adenophostin A (2 μM), and leak-subtraction of the measured currents was obtained at the end of each experiment by application of an external solution containing La3+ (100 μM).

Similar articles

Cited by

References

    1. Adams JC, Lawler J. The thrombospondins. Cold Spring Harb. Perspect. Biol. 2011;3:a009712. - PMC - PubMed
    1. Ambily A, Kaiser WJ, Pierro C, Chamberlain EV, Li Z, Jones CI, Kassouf N, Gibbins JM, Authi KS. The role of plasma membrane STIM1 and Caentry in platelet aggregation. STIM1 binds to novel proteins in human platelets. Cell. Signal. 2014;26:502–511. - PMC - PubMed
    1. Bale MD, Mosher DF. Thrombospondin is a substrate for blood coagulation factor XIIIa. Biochemistry. 1986;25:5667–5673. - PubMed
    1. Bornstein P, O’Rourke K, Wilstrom L, Wolf FW, Katz R, Li P, Dixit VM. A second, expressed thrombospondin gene (Thbs2) exists in the mouse genome. J. Biol. Chem. 1991;266:12821–12824. - PubMed
    1. Carlson CB, Bernstein DA, Annis DS, Misenheimer TM, Hannah BL, Mosher DF, Keck JL. Structure of the calcium-rich signature domain of human thrombospondin-2. Nat. Struct. Mol. Biol. 2005;12:910–914. - PMC - PubMed

Publication types

LinkOut - more resources