

Direct identification of tyrosine sulfation by using ultraviolet photodissociation mass spectrometry
- PMID: 24845354
- PMCID: PMC4108549
- DOI: 10.1007/s13361-014-0910-3
Direct identification of tyrosine sulfation by using ultraviolet photodissociation mass spectrometry
Abstract
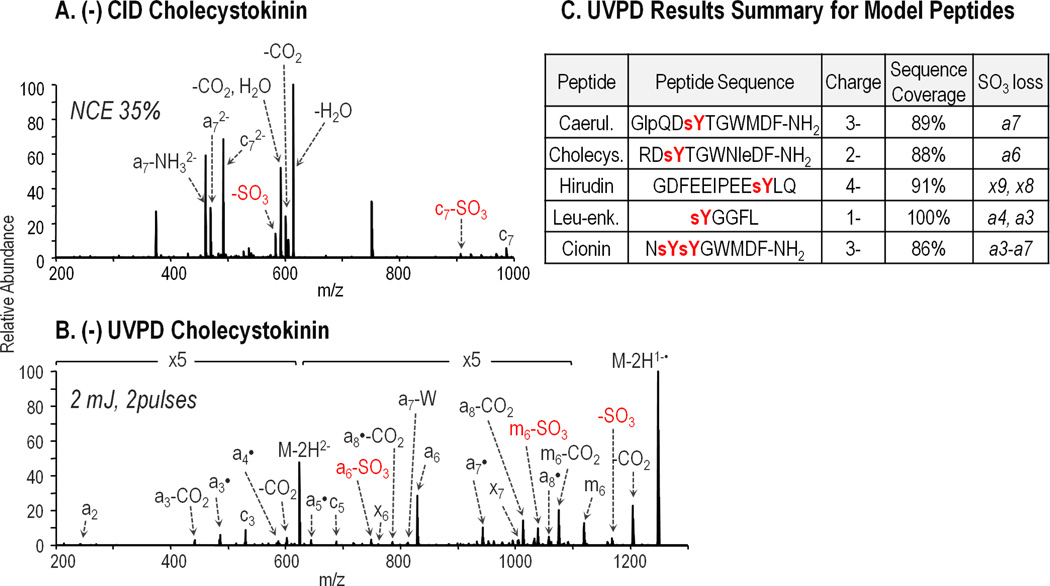
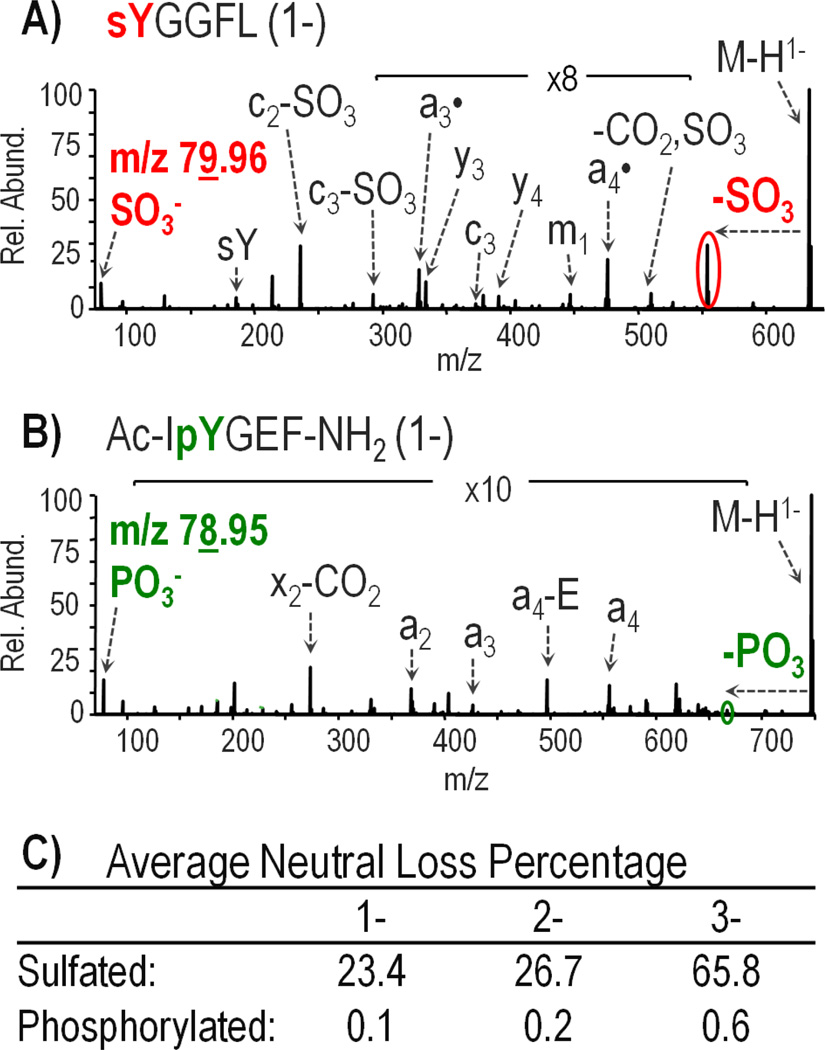
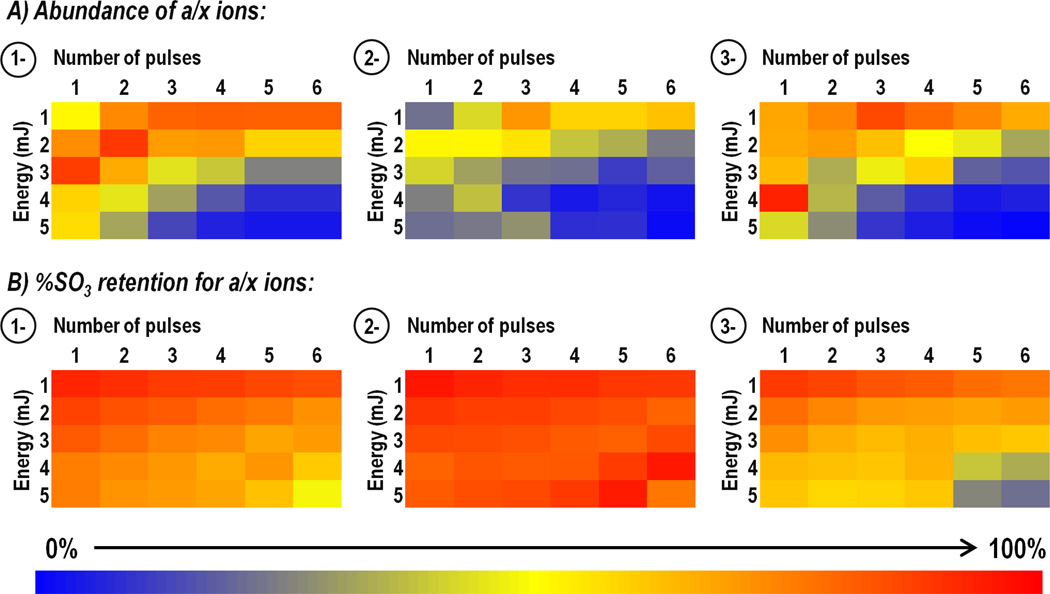
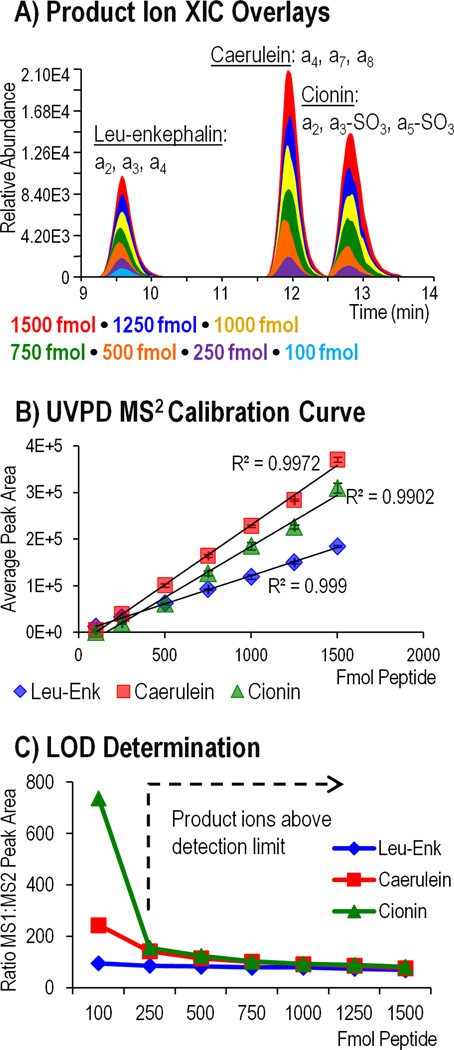
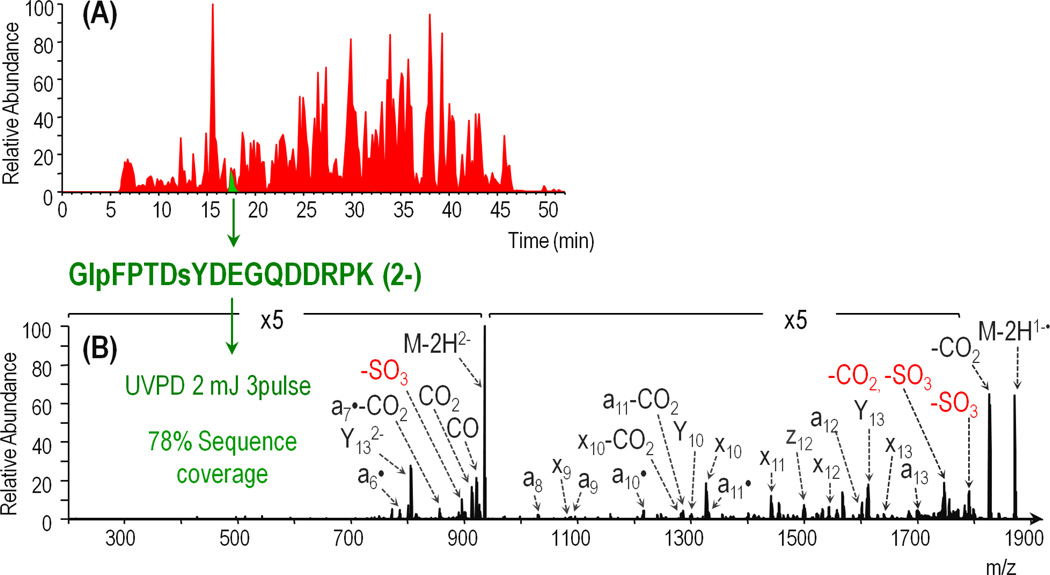
Sulfation is a common post-translational modification of tyrosine residues in eukaryotes; however, detection using traditional liquid chromatography-mass spectrometry (LC-MS) methods is challenging based on poor ionization efficiency in the positive ion mode and facile neutral loss upon collisional activation. In the present study, 193 nm ultraviolet photodissociation (UVPD) is applied to sulfopeptide anions to generate diagnostic sequence ions, which do not undergo appreciable neutral loss of sulfate even using higher energy photoirradiation parameters. At the same time, neutral loss of SO₃ is observed from the precursor and charge-reduced precursor ions, a spectral feature that is useful for differentiating tyrosine sulfation from the nominally isobaric tyrosine phosphorylation. LC-MS detection limits for UVPD analysis in the negative mode were determined to be around 100 fmol for three sulfated peptides, caerulein, cionin, and leu-enkephalin. The LC-UVPD-MS method was applied for analysis of bovine fibrinogen, and its key sulfated peptide was confidently identified.
Figures
Similar articles
-
Electron Capture vs Transfer Dissociation for Site Determination of Tryptic Peptide Tyrosine Sulfation: Direct Detection of Fibrinogen Sulfation Sites and Identification of Novel Isobaric Interferences.J Proteome Res. 2024 Jul 5;23(7):2386-2396. doi: 10.1021/acs.jproteome.4c00072. Epub 2024 Jun 20. J Proteome Res. 2024. PMID: 38900499 Free PMC article.
-
Stability of tyrosine sulfate in acidic solutions.Anal Biochem. 2007 Apr 1;363(1):70-6. doi: 10.1016/j.ab.2006.12.003. Epub 2006 Dec 28. Anal Biochem. 2007. PMID: 17307131
-
An innovative strategy for sulfopeptides analysis using MALDI-TOF MS reflectron positive ion mode.Proteomics. 2012 Aug;12(14):2247-57. doi: 10.1002/pmic.201100525. Proteomics. 2012. PMID: 22887944
-
Mapping posttranslational modifications of proteins by MS-based selective detection: application to phosphoproteomics.Methods Enzymol. 2005;405:82-115. doi: 10.1016/S0076-6879(05)05005-6. Methods Enzymol. 2005. PMID: 16413312 Review.
-
Revealing the functional roles of tyrosine sulfation using synthetic sulfopeptides and sulfoproteins.Curr Opin Chem Biol. 2020 Oct;58:72-85. doi: 10.1016/j.cbpa.2020.05.007. Epub 2020 Aug 7. Curr Opin Chem Biol. 2020. PMID: 32777686 Review.
Cited by
-
Covalent Chemical Tools for Profiling Post-Translational Modifications.Front Chem. 2022 Jul 4;10:868773. doi: 10.3389/fchem.2022.868773. eCollection 2022. Front Chem. 2022. PMID: 35860626 Free PMC article. Review.
-
Phosphorylation and sulfation share a common biosynthetic pathway, but extend biochemical and evolutionary diversity of biological macromolecules in distinct ways.J R Soc Interface. 2022 Aug;19(193):20220391. doi: 10.1098/rsif.2022.0391. Epub 2022 Aug 3. J R Soc Interface. 2022. PMID: 35919982 Free PMC article.
-
The Key Role of Metal Adducts in the Differentiation of Phosphopeptide from Sulfopeptide Sequences by High-Resolution Mass Spectrometry.Anal Chem. 2022 Jul 5;94(26):9234-9241. doi: 10.1021/acs.analchem.1c05621. Epub 2022 Jun 17. Anal Chem. 2022. PMID: 35714062 Free PMC article.
-
Considerations for defining +80 Da mass shifts in mass spectrometry-based proteomics: phosphorylation and beyond.Chem Commun (Camb). 2023 Sep 26;59(77):11484-11499. doi: 10.1039/d3cc02909c. Chem Commun (Camb). 2023. PMID: 37681662 Free PMC article. Review.
-
Preparation and Analysis of N-Terminal Chemokine Receptor Sulfopeptides Using Tyrosylprotein Sulfotransferase Enzymes.Methods Enzymol. 2016;570:357-88. doi: 10.1016/bs.mie.2015.09.004. Epub 2015 Nov 14. Methods Enzymol. 2016. PMID: 26921955 Free PMC article.
References
-
- Mann M, Jensen ON. Proteomic analysis of post-translational modifications. Nat Biotech. 2003;21:255–261. - PubMed
-
- Bettelheim FR. TYROSINE-O-SULFATE IN A PEPTIDE FROM FIBRINOGEN. J. Am. Chem. Soc. 1954;76:2838–2839.
-
- Huttner WB. Sulphation of tyrosine residues-a widespread modification of proteins. Nature. 1982;299:273–276. - PubMed
-
- Baeuerle PA, Huttner WB. Tyrosine sulfation of yolk proteins 1, 2, and 3 in Drosophila melanogaster. Journal of Biological Chemistry. 1985;260:6434–6439. - PubMed
-
- Beisswanger Roland, Corbeil D, Vannier C, Thiele C, Dohrmann U, Kellner Roland, Ashman K, Niehrs Christof, Huttner Wieland B. Existence of Distinct Tyrosylprotein Sulfotransferase Genes: Molecular Characterization of Tyrosylprotein Sulfotransferase-2. Proceedings of the National Academy of Sciences of the United States of America. 1998;95:11134–11139. - PMC - PubMed
Publication types
MeSH terms
Substances
Grants and funding
LinkOut - more resources
Full Text Sources
Other Literature Sources
