Modelling the force of infection for hepatitis A in an urban population-based survey: a comparison of transmission patterns in Brazilian macro-regions
- PMID: 24845598
- PMCID: PMC4028178
- DOI: 10.1371/journal.pone.0094622
Modelling the force of infection for hepatitis A in an urban population-based survey: a comparison of transmission patterns in Brazilian macro-regions
Abstract
Background: This study aimed to identify the transmission pattern of hepatitis A (HA) infection based on a primary dataset from the Brazilian National Hepatitis Survey in a pre-vaccination context. The national survey conducted in urban areas disclosed two epidemiological scenarios with low and intermediate HA endemicity.
Methods: A catalytic model of HA transmission was built based on a national seroprevalence survey (2005 to 2009). The seroprevalence data from 7,062 individuals aged 5-69 years from all the Brazilian macro-regions were included. We built up three models: fully homogeneous mixing model, with constant contact pattern; the highly assortative model and the highly assortative model with the additional component accounting for contacts with infected food/water. Curves of prevalence, force of infection (FOI) and the number of new infections with 99% confidence intervals (CIs) were compared between the intermediate (North, Northeast, Midwest and Federal District) and low (South and Southeast) endemicity areas. A contour plot was also constructed.
Results: The anti- HAV IgG seroprevalence was 68.8% (95% CI, 64.8%-72.5%) and 33.7% (95% CI, 32.4%-35.1%) for the intermediate and low endemicity areas, respectively, according to the field data analysis. The models showed that a higher force of infection was identified in the 10- to 19-year-old age cohort (∼9,000 infected individuals per year per 100,000 susceptible persons) in the intermediate endemicity area, whereas a higher force of infection occurred in the 15- to 29-year-old age cohort (∼6,000 infected individuals per year per 100,000 susceptible persons) for the other macro-regions.
Conclusion: Our findings support the shift of Brazil toward intermediate and low endemicity levels with the shift of the risk of infection to older age groups. These estimates of HA force of infection stratified by age and endemicity levels are useful information to characterize the pre-vaccination scenario in Brazil.
Conflict of interest statement
Figures


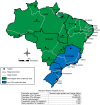
 year−2 and
  year−1 for the intermediate endemicity area and
  year−2 and
  year−1 for the low endemicity area.

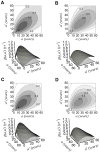
 year−2,
  year−1,
  year and
  ; (B)
; (B)  year−2,
  year−1,
  year and
  ; (C)
; (C)  year−2,
  year−1,
  year,
year,  and
and  year−1; (D)
  year−2,
  year−1,
  year,
year,  and
and  year−1; for the fully homogeneous model (not shown),
  year−1 (intermediate) and
  year−1 (low).
References
-
- WHO (2012) WHO position paper on hepatitis A vaccines − June 2012. Wkly Epidemiol Rec 87: 261–276. - PubMed
-
- Jacobsen KH, Wiersma ST (2010) Hepatitis A virus seroprevalence by age and world region, 1990 and 2005. Vaccine 28: 6653–6657. - PubMed
-
- Vacchino MN (2008) Incidence of hepatitis A in Argentina after vaccination. J Viral Hepat (Suppl 2): 47–50. - PubMed
-
- Vogt TM, Wise ME, Bell BP, Finelli L (2008) Declining hepatitis A mortality in the United States during the era of hepatitis A vaccination. J Infect Dis 197: 1282–1288. - PubMed
-
- Vitral CL, Gaspar AM, Souto FJ (2006) Epidemiological pattern and mortality rates for hepatitis A in Brazil, 1980–2002– a review. Mem Inst Oswaldo 101: 119–127. - PubMed
Publication types
MeSH terms
LinkOut - more resources
Full Text Sources
Other Literature Sources
Medical

