. 2014 Jun;25(3):206-19.
doi: 10.1089/hgtb.2013.122.

A new method for generating insulin-secreting cells from human pancreatic epithelial cells after islet isolation transformed by NeuroD1

Affiliations

A new method for generating insulin-secreting cells from human pancreatic epithelial cells after islet isolation transformed by NeuroD1

Masayuki Shimoda et al. Hum Gene Ther Methods. 2014 Jun.

Abstract

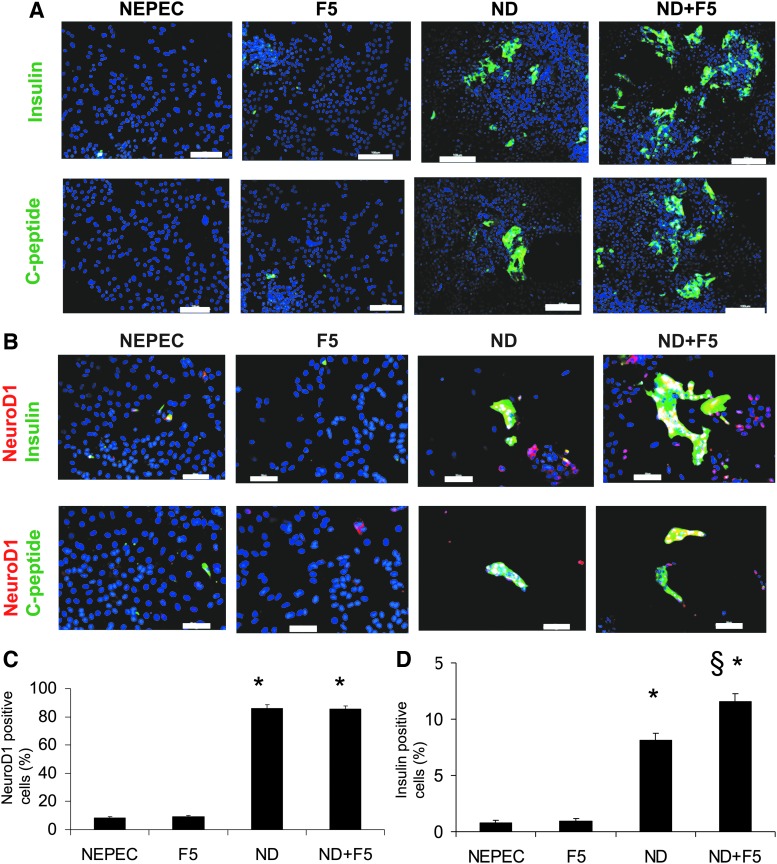
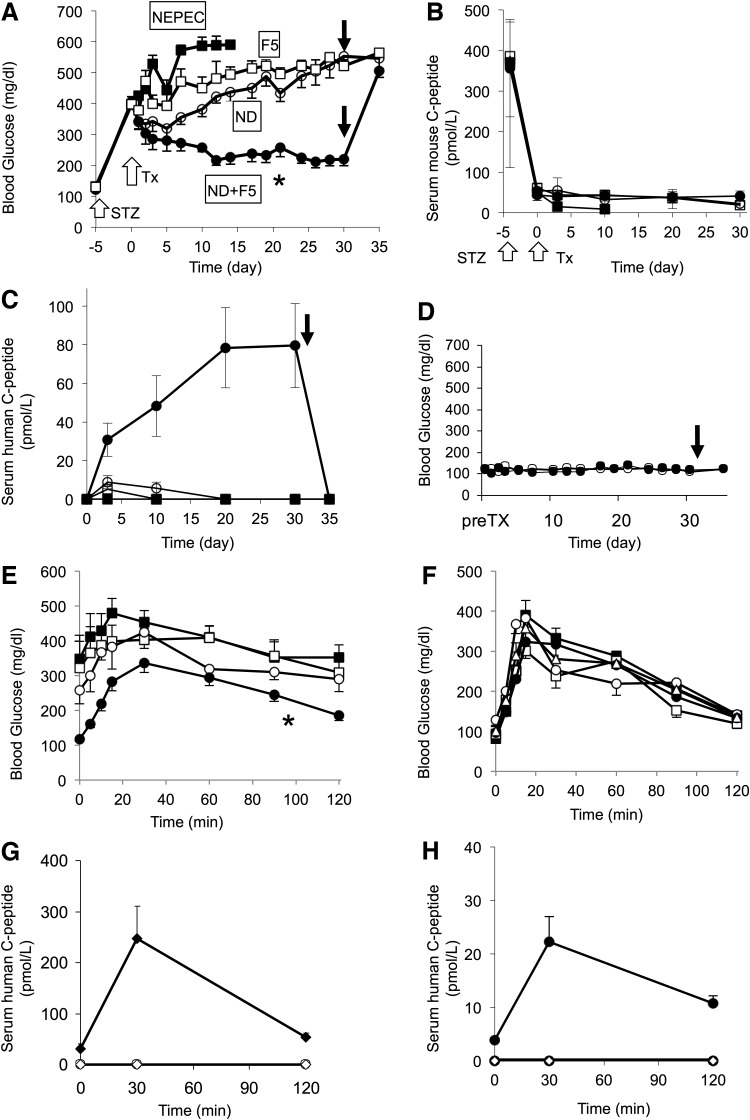
The generation of insulin-secreting cells from nonendocrine pancreatic epithelial cells (NEPEC) has been demonstrated for potential clinical use in the treatment of diabetes. However, previous methods either had limited efficacy or required viral vectors, which hinder clinical application. In this study, we aimed to establish an efficient method of insulin-secreting cell generation from NEPEC without viral vectors. We used nonislet fractions from both research-grade human pancreata from brain-dead donors and clinical pancreata after total pancreatectomy with autologous islet transplantation to treat chronic pancreatitis. It is of note that a few islets could be mingled in the nonislet fractions, but their influence could be limited. The NeuroD1 gene was induced into NEPEC using an effective triple lipofection method without viral vectors to generate insulin-secreting cells. The differentiation was promoted by adding a growth factor cocktail into the culture medium. Using the research-grade human pancreata, the effective method showed high efficacy in the differentiation of NEPEC into insulin-positive cells that secreted insulin in response to a glucose challenge and improved diabetes after being transplanted into diabetic athymic mice. Using the clinical pancreata, similar efficacy was obtained, even though those pancreata suffered chronic pancreatitis. In conclusion, our effective differentiation protocol with triple lipofection method enabled us to achieve very efficient insulin-secreting cell generation from human NEPEC without viral vectors. This method offers the potential for supplemental insulin-secreting cell transplantation for both allogeneic and autologous islet transplantation.


Figures

<b>FIG. 1.</b>
FIG. 1.
Pancreatic nonendocrine cells after isolation and NEPEC after differentiation protocol. (A and B) Representative figures of the human pancreatic nonislet fraction (A) immediately after islet isolation and (B) 4 days after suspension culture with G418. The arrow indicates a contaminated islet detected by dithizone staining. Scale bars: 100 μm. (C) A ratio of cell proliferation of the four groups. The cell number at day 1 after starting cell attachment culture was used as the starting point (=1.0). At day 7, the differentiation procedure started. There was no significant difference of proliferation among the four groups. (D) Morphology of NEPECs of the four groups at day 7 after differentiation. Scale bars: 100 μm. (E) Effective induction of human NeuroD1 into NEPEC, shown through immunohistochemistry of the four groups 7 days after the start of differentiation. Most CK19-positive cells produced NeuroD1 in the ND and ND+F5 groups. Green, CK19; red, human NeuroD1; blue, DAPI. Scale bars: 50 μm. (F and G) Gene expression profile of the differentiated NEPEC. The human islets and the four groups of cells were harvested 7 days after the initiation of differentiation. A panel of genes was assessed by quantitative real-time PCR. For statistical analysis, ANOVA and t-test with Bonferroni adjustments were used. (F) Relative quantification represents the fold change of expression between each group and the NEPEC group (NEPEC=1.0). (G) Relative quantification represents the fold change of expression between each group and human islets (islets=1.0). For CK19, the relative values of the 4 groups were presented (NEPEC=1.0). Data are presented as mean±standard error of five independent experiments. *p<0.01 in ND+F5 group vs. all other groups. **p<0.01 in ND+F5 group vs. NEPEC and F5 groups. ANOVA, analysis of variance; GCG, glucagon; GK, glucokinase; NEPEC, nonendocrine pancreatic epithelial cells; Ngn3, neurogenin-3; PPY, pancreatic polypeptide; SST, somatostatin.
<b>FIG. 2.</b>
FIG. 2.
NeuroD1 promotes NEPEC differentiation. (A) Immunostaining for human insulin (upper panels) and C-peptide (lower panels) of the four groups at day 7 after differentiation. Green, insulin or C-peptide; blue, DAPI. Scale bar: 100 μm. Magnification: 100×. (B) Immunostaining for human NeuroD1, insulin (upper panels), and C-peptide (lower panels) of the four groups at day 7 after differentiation. Green, insulin or C-peptide; red, human NeuroD1; blue, DAPI. Scale bar: 50 μm. Magnification: 200×. Percentage of the cells expressing NeuroD1 (C) and insulin (D) as determined by immunohistochemistry at day 7 after differentiation. The NeuroD1 or insulin-positive cells were counted using more than 20 photomicrographs at a magnification of 200×. *p<0.00001 between the ND group vs. NEPEC and F5 and between ND+F5 vs. NEPEC and F5 (C and D). §p<0.002 between ND+F5 vs. all other groups (D). Values are presented as mean±standard error of five independent experiments. For statistical analysis, ANOVA and t-test with Bonferroni adjustments were used.
<b>FIG. 3.</b>
FIG. 3.
Characteristics of insulin-positive cells in ND+F5 at day 7 in vitro. (A) CK19 expression was very low in the insulin-positive cells. The cells strongly coexpressed C-peptide (B), PDX1 (C), and neurogenin-3 (D), whereas glucagon (E), somatostatin (F), amylase (G), and Sox9 (H) were negative. Original magnification: 400×. Scale bar: 25 μm. In micrographs, DAPI was used for nuclear staining (blue). (I–N) Insulin secretion potency and glucose responsiveness. (I) Assessment of cellular C-peptide content in the four groups at day 7 after differentiation (n=5). Values were normalized by cell numbers (per 1×10⁶ cells). (J) The ratio of the C-peptide content of the four groups to human islets. *p<0.001 between the ND group vs. NEPEC and F5, and between ND+F5 vs. NEPEC and F5. §p<0.01 between ND+F5 vs. ND group. (K and L) Human insulin (K) and C-peptide (L) levels in the culture media of the four groups at day 7 after differentiation (n=5). Values were normalized by cell numbers. *p<0.001 between ND+F5 vs. NEPEC, F5, ND, and islets. (M and N) C-peptide secretion in response to glucose. (M) The culture medium was replaced with a fresh medium with 2.8 mM (white bar) or 25 mM glucose (black bar) for 1 hr. C-peptide levels were measured and normalized by cell number (n=5). Human islets were used as a control. *p<0.001 between 2.8 mM vs. 25 mM. (N) SI of the four groups (N=5). SI was calculated by dividing the C-peptide concentration of 25 mM glucose by that of 2.8 mM glucose. *p<0.001 between ND+F5 vs. NEPEC, F5, ND, and islets. All values are presented as mean±standard error. For statistical analysis, ANOVA and t-test with Bonferroni adjustments were used. SI, stimulation index.
<b>FIG. 4.</b>
FIG. 4.
Improvement of diabetes after transplantation of the cells. (A) Nonfasting blood glucose levels in diabetic nude mice with subcapsular kidney transplantation for NEPEC (black squares, n=5), F5 (white squares, n=5), ND (white circles, n=8), and ND+F5 (black circles, n=16). At day 32, nephrectomy was performed (black arrow). The blood glucose levels in the ND+F5 group were significantly decreased (*p<0.001 vs. F5 and ND by RM-ANOVA). White arrows indicate the STZ administration and the transplantation of the cells. (B and C) Serum mouse and human C-peptide levels in mice transplanted with NEPEC (black squares, n=5), F5 (white squares, n=5), ND (white circles, n=8), and ND+F5 (black circles, n=16). Mouse C-peptide (B) and human C-peptide (C) before STZ injection, before transplant and at days 3, 10, 20, and 30 after transplant. White arrows indicate the STZ administration and the transplantation of the cells. At day 32, nephrectomy was performed (black arrow, C). (D) Nonfasting blood glucose levels in normal nude mice with ND+F5 transplanted (black circles, n=5). Untreated nude mice were used as a control (white circle, n=5). The arrow indicates nephrectomy at day 32. The ND+F5 group showed no remarkable change. (E–H) Glucose tolerance test at day 31. After the mice had fasted for 12 hr, glucose (2 g/kg) was intraperitoneally injected. The blood glucose levels were measured for 120 min after injection. At 0, 30, and 120 min, blood was taken for measurement of serum human C-peptide levels. (E) Blood glucose levels after a glucose tolerance test in diabetic nude mice for STZ control (black squares, n=5) and F5 (white squares, n=5), ND (white circles, n=8), and ND+F5 (black circles, n=16). The transplant of ND+F5 cells lowered glucose levels during the test (*p<0.02 vs. STZ by RM-ANOVA). (F) Blood glucose levels in normal nude mice for untreated control (white triangles, n=5), NEPEC (black squares, n=5), F5 (white squares, n=5), ND (white circles, n=5), and ND+F5 (black circles, n=5). There was no significant difference between the five groups. (G and H) Serum human C-peptide levels during the glucose tolerance test. All values are presented as mean±standard error. (G) F5 (white circle, n=5) or ND cells (white diamond, n=8) or ND+F5 cells (black circles, n=16) were transplanted into diabetic nude mice. Human C-peptide was not detected in the NEPEC group or the ND group. (H) ND cells (white diamond, n=5) or ND+F5 cells (black circles, n=5) were transplanted into normal nude mice. Untreated normal nude mice were used for control (white circle, n=5). Human C-peptide was not detected in control and ND group mice. RM-ANOVA, repeated-measures ANOVA; STZ, streptozotocin; Tx, Transplantation.
<b>FIG. 5.</b>
FIG. 5.
ND+F5 cells differentiated toward beta cells in vivo. Histological and immunohistochemical characteristics of the kidney subcapsular region of ND+F5 transplantation at day 32. (AC) Histological sections of the transplant site. (A and B) The transplanted cells were detected as a thin layer on the kidney surface. (C) Some cells formed ductal structures. Magnification: (A) 40×; (B and C) 200×. Scale bars: (A) 250 μm; (B and C) 50 μm. Arrows indicate the graft. (DL) Immunofluorescence analysis of grafts. (DE) Staining for CK19 (green) and insulin (red). (F) Staining for insulin (green) and C-peptide (red). (GI) Staining for insulin (green), PDX1 (red), NeuroD1 (red), and Nkx6.1 (red). (J) Ratio of PDX1-, NeuroD1-, Nkx6.1-positive cells in the insulin-positive cells at day 32 after transplant. For statistical analysis, ANOVA and t-test with Bonferroni adjustments were used. (KM) Staining for insulin (red), glucagon (green), somatostatin (green), and amylase (green). (N and O) Cell proliferation of the insulin-positive cells in the graft of the ND+F5 cells at day 3 (N) and day 32 (O) after transplant. Staining for insulin (green), Ki67 (red), and DAPI (blue). (P) Ratio of Ki67-positive cells in the insulin-positive cells at day 3 and day 32 after transplant. In all micrographs, DAPI was used for nuclear staining (blue). Scale bars: (D and E) 100 μm; others, 25 μm. Original magnification: (D and E) 100×; others, 400×. White line, border of graft; K, kidney; G, graft; Ins, insulin; GCG, glucagon. The schema of the engrafted cells and kidney surface is illustrated (B, D, and E). K, kidney; G, graft cells; C, connective tissue.
<b>FIG. 6.</b>
FIG. 6.
Effects of transplantation of the ND+F5 cells derived from pancreata with chronic pancreatitis. (A) Nonfasting blood glucose levels in diabetic nude mice with subcapsular kidney transplantation for ND+F5 (n=12). At day 32, nephrectomy was performed (arrow). The blood glucose increased to pretransplant levels. White arrows indicate the STZ administration and the transplantation of the cells. (B) Human C-peptide before transplant and at days 3, 10, 20, and 30 after transplant. At day 32, nephrectomy was performed (black arrow). (C) Blood glucose levels after a glucose tolerance test in diabetic nude mice (day 31) for ND+F5 (n=12). (D) Serum human C-peptide levels during the glucose tolerance test at day 31 (n=12). All values are presented as mean±standard error. (EJ) Histological and immunohistochemical characteristics of the kidney subcapsular region of ND+F5 transplantation at day 32. (E) A histological section of the transplant site. The transplanted cells were detected as a thin layer on the kidney surface. Magnification: 200×. Scale bar: 50 μm. (FJ) Immunofluorescence analysis of grafts. (F and G) Staining for CK19 (green) and insulin (red). (HJ) Staining for insulin (green), PDX1 (red), NeuroD1 (red), and Nkx6.1 (red). In all micrographs, DAPI was used for nuclear staining (blue). Scale bars: (D and E) 50 μm; (HJ) 25 μm. Original magnification: (F and G) 200×; (HJ) 400×. White line, border of graft; K, kidney; G, graft; Ins, insulin. The schema of the engrafted cells and kidney surface is illustrated (E). K, kidney; G, graft cells; C, connective tissue.

Similar articles

References

    1. Baeyens L., Bonné S., Bos T., et al. (2009). Notch signaling as gatekeeper of rat acinar-to-beta-cell conversion in vitro. Gastroenterology 136, 1750–1760 - PubMed
    1. Bogdani M., Lefebvre V., Buelens N., et al. (2003). Formation of insulin-positive cells in implants of human pancreatic duct cell preparations from young donors. Diabetologia 46, 830–838 - PubMed
    1. Bonner-Weir S., Taneja M., Weir G.C., et al. (2000). In vitro cultivation of human islets from expanded ductal tissue. Proc. Natl. Acad. Sci. USA 97, 7999–8004 - PMC - PubMed
    1. Chao C.S., Loomis Z.L., Lee J.E., et al. (2007). Genetic identification of a novel NeuroD1 function in the early differentiation of islet alpha, PP and epsilon cells. Dev. Biol. 312, 523–532 - PMC - PubMed
    1. Chen S., Shimoda M., Wang M., et al. (2010). Regeneration of pancreatic islets in vivo by ultrasound-targeted gene therapy. Gene Ther. 17, 1411–1420 - PMC - PubMed

Publication types

MeSH terms

LinkOut - more resources