. 2015 Sep;25(9):3077-85.
doi: 10.1093/cercor/bhu103. Epub 2014 May 20.

Delta-Beta Coupled Oscillations Underlie Temporal Prediction Accuracy

Affiliations

Delta-Beta Coupled Oscillations Underlie Temporal Prediction Accuracy

Luc H Arnal et al. Cereb Cortex. 2015 Sep.

Abstract

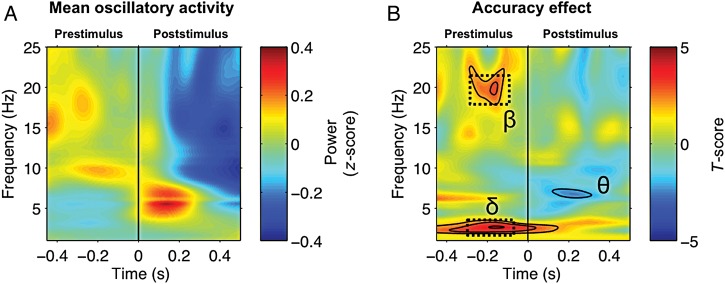
The ability to generate temporal predictions is fundamental for adaptive behavior. Precise timing at the time-scale of seconds is critical, for instance to predict trajectories or to select relevant information. What mechanisms form the basis for such accurate timing? Recent evidence suggests that (1) temporal predictions adjust sensory selection by controlling neural oscillations in time and (2) the motor system plays an active role in inferring "when" events will happen. We hypothesized that oscillations in the delta and beta bands are instrumental in predicting the occurrence of auditory targets. Participants listened to brief rhythmic tone sequences and detected target delays while undergoing magnetoencephalography recording. Prior to target occurrence, we found that coupled delta (1-3 Hz) and beta (18-22 Hz) oscillations temporally align with upcoming targets and bias decisions towards correct responses, suggesting that delta-beta coupled oscillations underpin prediction accuracy. Subsequent to target occurrence, subjects update their decisions using the magnitude of the alpha-band (10-14 Hz) response as internal evidence of target timing. These data support a model in which the orchestration of oscillatory dynamics between sensory and motor systems is exploited to accurately select sensory information in time.

Keywords: auditory; motor; neuronal oscillations; sensorimotor; timing.


Figures

Figure 1.
Figure 1.
Experimental design and sequential processing model. (A) Experimental paradigm. Participants were instructed to listen to a sequence of 4 or 5 tones and were asked to judge whether the last tone (target) was delayed or not with regard to the beat. (B) Experimental design. Two analysis factors are derived from this design. The factor Accuracy determines whether participant's response was correct or not with regard to the delay. The factor Decision relies on participant's subjective report, that is, whether the target was perceived as “normal” or “delayed”. (C) Sequential model for predictive processing and decision-making. We assumed that contrasting the different levels of the factors Accuracy and Decision permits to reveal 2 distinct processing stages, respectively: (1) the prediction stage and (2) the decision stage (see Materials and methods).
Figure 2.
Figure 2.
Time–frequency analysis of pre- to poststimulus MEG activity and accuracy effects. (A) Mean oscillatory activity of responses to target tones in auditory sensors (selected individually, see Materials and methods). Time is expressed relative to target onset (black vertical line). (B) Accuracy effect (correct minus incorrect stimulus) on oscillatory activity. Effect is expressed in t-scores; contours indicate significance thresholds of P < 0.05, 0.01, and 0.001 for those clusters that survived the correction for multiple comparisons (see Materials and methods and Maris and Oostenveld 2007). Black dashed boxes highlight prestimulus (−300 to −100 ms) Accuracy effects in delta (1–3 Hz) and beta (18–22 Hz) power, corresponding to a stronger increase in these 2 frequency bands for targets that are subsequently correctly perceived.
Figure 3.
Figure 3.
Accuracy effects on delta (1–3 Hz) phase, beta (18–22 Hz) power and delta–beta cross-frequency coupling. (A) Phase distribution difference (Watson–Williams test across trials) at the topographical level between correct and incorrect trials in delta (1–3 Hz) band. Thick black dots highlight the cluster of auditory sensors that reach the P < 0.05 significance threshold and survived correction for multiple comparisons. The following analyses of delta phase are computed on the circular average of phase signals extracted from this sensor selection. Two other sensor clusters lying over anterior auditory sensors and motor sensors showed significant (P < 0.05, uncorrected) phase distribution difference between correct and incorrect trials. (B) Left, distribution of delta-phase angles across trials in the time window of interest. Phase-angle distributions significantly differ between correct (blue) and incorrect (red) trials (Watson–Williams test; P < 10−5), mean angles being practically in opposite phase. Right, phase histogram showing the proportion of trials in each phase bin (phase distribution equally spaced in 9 phase-bins) for correct (blue) and incorrect (red) trials. (C) Accuracy effect on beta-band (18–22 Hz) oscillatory activity, expressed in z-score difference between correct and incorrect trials. Thick black dots highlight the cluster lying over auditory sensors that reach the P < 0.05 significance threshold and survived correction for multiple comparisons. (D) Time-courses of beta-band activity expressed in z-score in the auditory sensor cluster for correct (blue) and incorrect (red) trials. Shaded error bars indicate standard error of mean (SEM) and the thick black line shows significance of the difference between correct and incorrect trials, after correction for multiple comparisons. (E) Cross-frequency delta–beta coupling (for both correct and incorrect trials) at the topographical level. Coupling is expressed in circular-to-linear correlation r-values calculated at each sensor and averaged on the prestimulus time-window (−300 to −100 ms) of interest (see Materials and methods). Thick dots indicate the cluster of sensors (threshold at n > 5 neighboring sensors) that reaches the P < 0.05 significance level (uncorrected). (F) Accuracy effect on delta–beta phase-amplitude coupling across time, calculated on the cluster of sensors selected on the topography in E. Coupling is expressed in circular-to-linear r-values, for correct (blue) and incorrect (red) conditions. Shaded error bars indicate SEM of the corresponding null distributions across 1000 permutations for each condition. The thick horizontal blue line indicates significant coupling in the correct condition only, after correction for multiple comparisons.
Figure 4.
Figure 4.
Time–frequency analysis of Delay and Decision effects. (A) Decision effect (delayed minus normal conditions) on mean oscillatory activity. Time is expressed relative to target onset (black vertical line). Effect is expressed in t-scores; contours indicate significance thresholds of P < 0.05, P < 0.01 and P < 0.001 for those time–frequency clusters that survived the correction for multiple comparisons (see Materials and methods). (B) Delay-by-Accuracy interaction effect on mean oscillatory activity. This map reveals the difference of the parametric effect of delays between correct and incorrect conditions (paired t-tests using individual slope values, see Materials and methods). The white dotted square highlights the time- (200–400 ms poststimulus) and frequency- (10–14 Hz) window of interest for subsequent plotting. (C) alpha-band activity extracted from the time frequency window of interest (right dotted square in panel B) expressed in z-score for each delay (x-axis) separately between correct (blue) and incorrect (red) conditions. Error bars indicate SEM. Gray dotted ellipses shows data-points grouped as a function of the Decision (normal vs. delayed).

References

    1. Adachi Y, Shimogawara M, Higuchi M, Haruta Y, Ochiai M. 2001. Reduction of nonperiodic environmental magnetic noise in MEG measurement by continuously adjusted least square method. IEEE Trans Appl Superconduct. 11:669–672.
    1. Arnal LH. 2012. Predicting “When” using the motor system’s beta-band oscillations. Front Hum Neurosci. 6:225. - PMC - PubMed
    1. Arnal LH, Giraud AL. 2012. Cortical oscillations and sensory predictions. Trends Cogn Sci. 16:390–398. - PubMed
    1. Arnal LH, Wyart V, Giraud AL. 2011. Transitions in neural oscillations reflect prediction errors generated in audiovisual speech. Nat Neurosci. 14:797–801. - PubMed
    1. Baker SN. 2007. Oscillatory interactions between sensorimotor cortex and the periphery. Curr Opin Neurobiol. 17:649–655. - PMC - PubMed

Publication types