

Case Reports
doi: 10.1161/CIRCIMAGING.113.001396.
How to image cardiac amyloidosis
Affiliations
- PMID: 24847009
- PMCID: PMC4118308
- DOI: 10.1161/CIRCIMAGING.113.001396
Item in Clipboard
Case Reports
How to image cardiac amyloidosis
Circ Cardiovasc Imaging.
2014 May.
No abstract available
Keywords: amyloidosis; cardiac imaging techniques; echocardiography; multimodal imaging; radionuclide imaging.
Figures
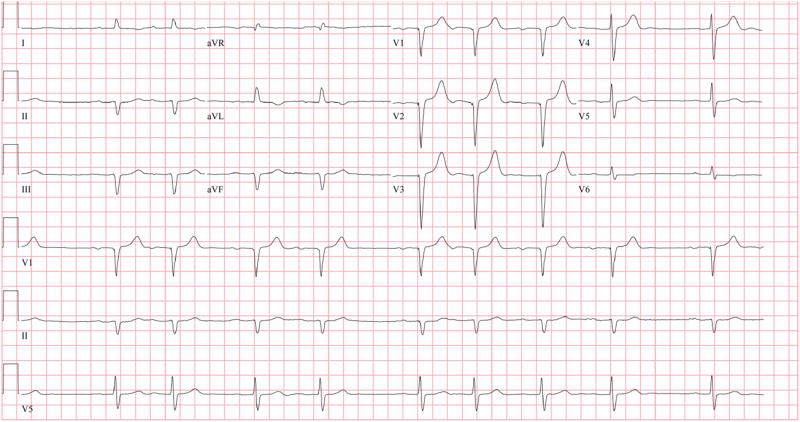
A 12 lead ECG showing first degree AV block with atrial premature beats and pseudo Q waves without typical low voltage complexes.
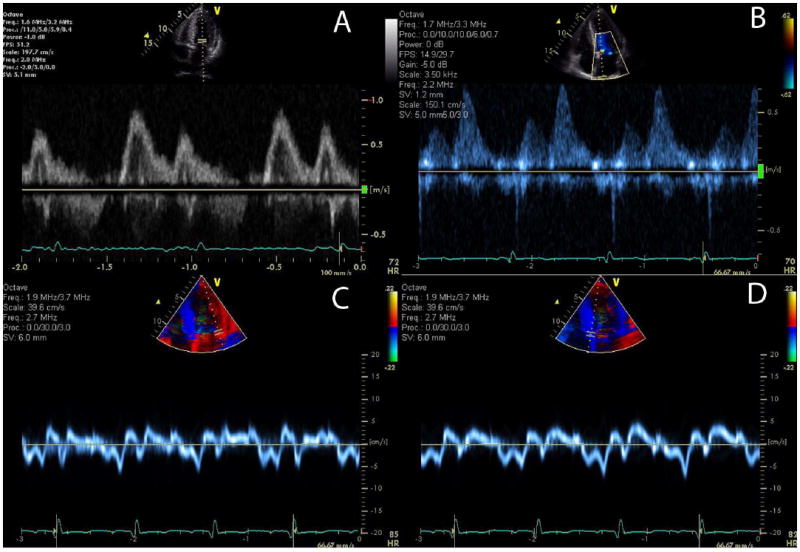
Images from a patient with AL amyloidosis demonstrate relatively normal mitral inflow parameters (E and A waves with normal deceleration time), but, abnormal pulmonary venous Doppler flow (diastolic predominance) and abnormal tissue Doppler images showing a reversed e’ and a’ ratio suggesting pseudonormalization of transmitral flow. E/e’ is elevated consistent with elevated left ventricular filling pressure.
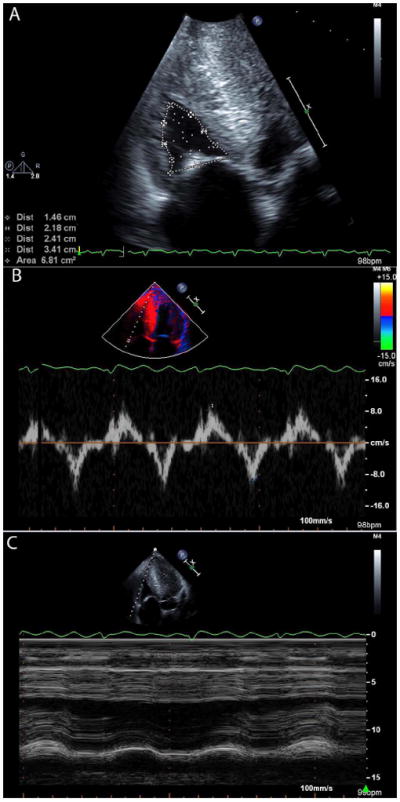
Images from a patient with wild-type ATTR (senile systemic) amyloidosis, showing increased right ventricular wall thickness with a small cavity size (A). Myocardial relaxation velocities on tissue Doppler imaging are reduced (B) and tricuspid annular plane excursion is reduced (B).
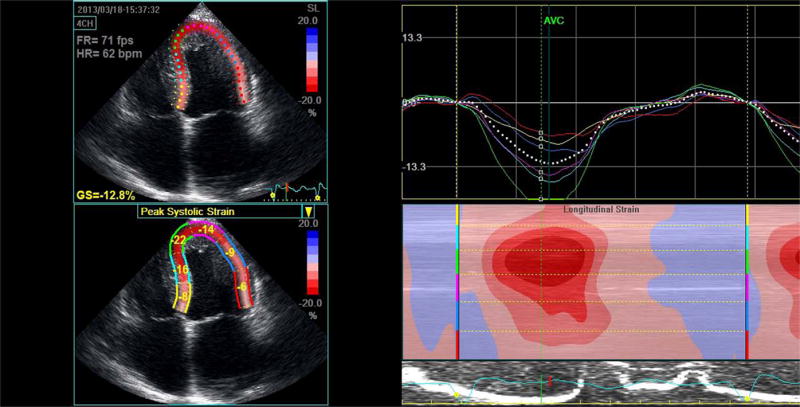
Apical 4-chamber peak systolic strain image illustrating a classic strain pattern of relatively well preserved apical strain (green and blue lines) with significant basal impairment (red and yellow lines). This is seen in the series of curves as well as the “bulls-eye” color coded strain image.
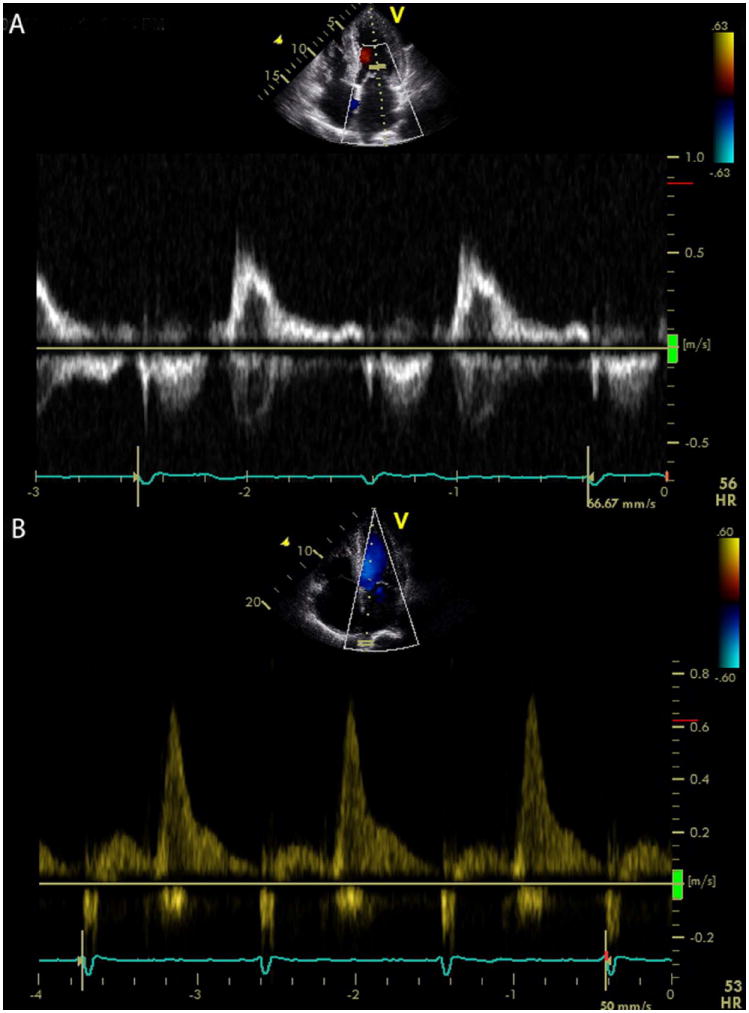
A transmitral Doppler image (A) showing a normal deceleration time but a very small A wave in an ATTR patient in sinus rhythm who presented with stroke, due to thrombus formation related to left atrial dysfunction. The pulmonary venous flow in a TTR amyloidosis patient (B) demonstrating almost exclusive diastolic flow due to restrictive filling-the atrium functions as a conduit with loss of contractile and reservoir function. This patient also had spontaneous echo contrast in the left ventricle (see Supplemental Video 2).
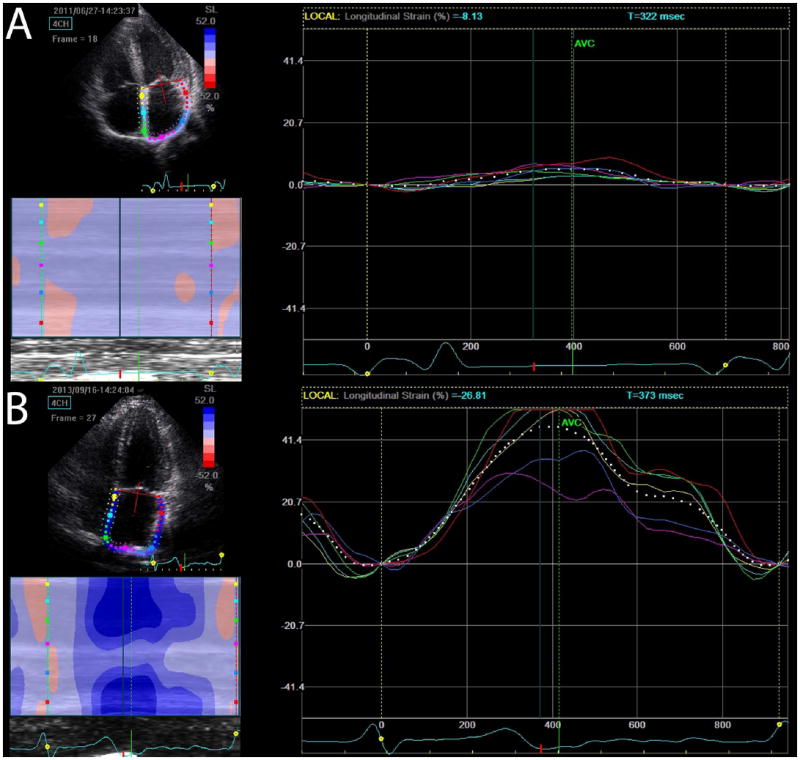
Atrial strain is significantly impaired globally in a subject with ATTR cardiac amyloidosis (A) contrasted with normal atrial strain in a gene positive phenotype negative subject (B).
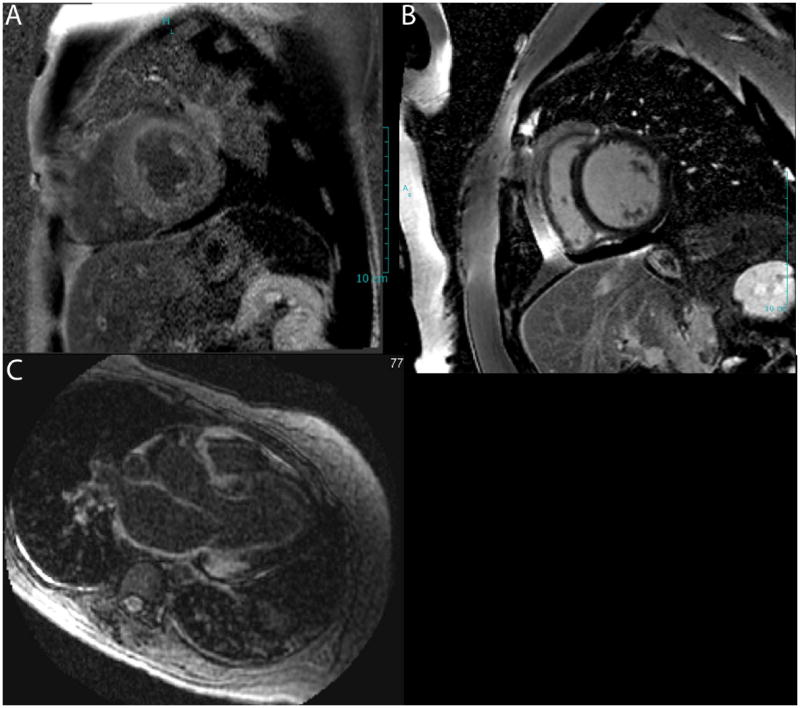
Late gadolinium enhanced images demonstrate diffuse LGE in the left ventricular myocardium (A) contrasted with dark myocardium a normal patient (B). The bottom panel (C) demonstrates LGE in the atrial wall, a characteristic feature of cardiac amyloidosis.
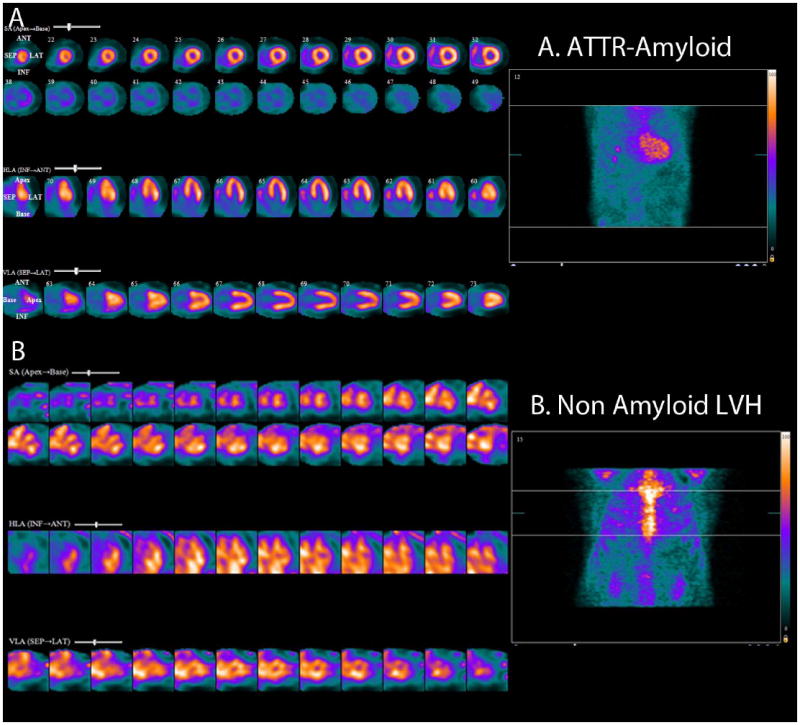
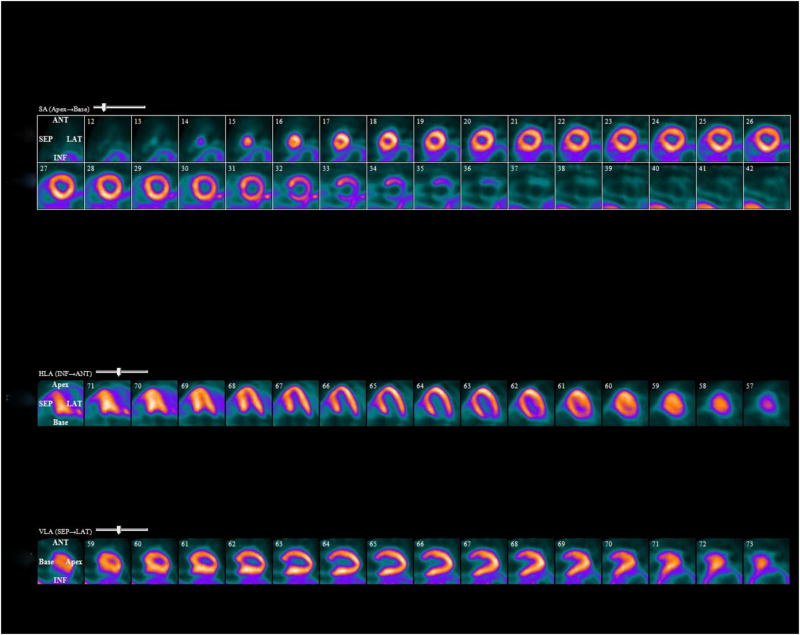
Note intense diffuse rest left and right ventricular myocardial uptake in a patient with ATTR cardiac amyloidosis (Top panel, standard cardiac imaging planes of short axis, horizontal long axis and vertical long axis projections). The bottom panel (standard cardiac imaging planes as above) shows blood pool activity and no myocardial uptake in a patient with non-amyloid LVH (left ventricular hypertrophy).
RestF-18 florbetapir PET images showing diffuse biventricular uptake of radiotracer in a patient with ATTR cardiac amyloidosis.
References
-
- Rahman JE, Helou EF, Gelzer-Bell R, Thompson RE, Kuo C, Rodriguez ER, Hare JM, Baughman KL, Kasper EK. Noninvasive diagnosis of biopsy-proven cardiac amyloidosis. J Am Coll Cardiol. 2004;43:410–415. - PubMed
-
- Murtagh B, Hammill SC, Gertz MA, Kyle RA, Tajik AJ, Grogan M. Electrocardiographic findings in primary systemic amyloidosis and biopsy-proven cardiac involvement. Am J Cardiol. 2005;95:535–537. - PubMed
-
- Rapezzi C, Merlini G, Quarta CC, Riva L, Longhi S, Leone O, Salvi F, Ciliberti P, Pastorelli F, Biagini E, Coccolo F, Cooke RM, Bacchi-Reggiani L, Sangiorgi D, Ferlini A, Cavo M, Zamagni E, Fonte ML, Palladini G, Salinaro F, Musca F, Obici L, Branzi A, Perlini S. Systemic cardiac amyloidoses: Disease profiles and clinical courses of the 3 main types. Circulation. 2009;120:1203–1212. - PubMed
-
- Koyama J, Ray-Sequin PA, Falk RH. Longitudinal myocardial function assessed by tissue velocity, strain, and strain rate tissue doppler echocardiography in patients with al (primary) cardiac amyloidosis. Circulation. 2003;107:2446–2452. - PubMed
-
- Cappelli F, Porciani MC, Bergesio F, Perlini S, Attana P, Moggi Pignone A, Salinaro F, Musca F, Padeletti L, Perfetto F. Right ventricular function in al amyloidosis: Characteristics and prognostic implication. Eur Heart J Cardiovasc Imaging. 2012;13:416–422. - PubMed
Publication types
MeSH terms
Grants and funding
LinkOut - more resources
Full Text Sources
Other Literature Sources
Medical
