

Time-varying, serotype-specific force of infection of dengue virus
- PMID: 24847073
- PMCID: PMC4084484
- DOI: 10.1073/pnas.1314933111
Time-varying, serotype-specific force of infection of dengue virus
Abstract
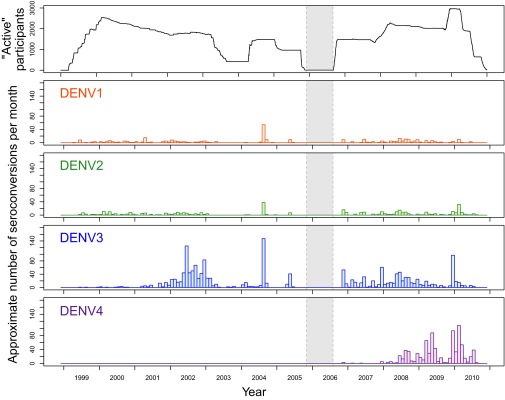
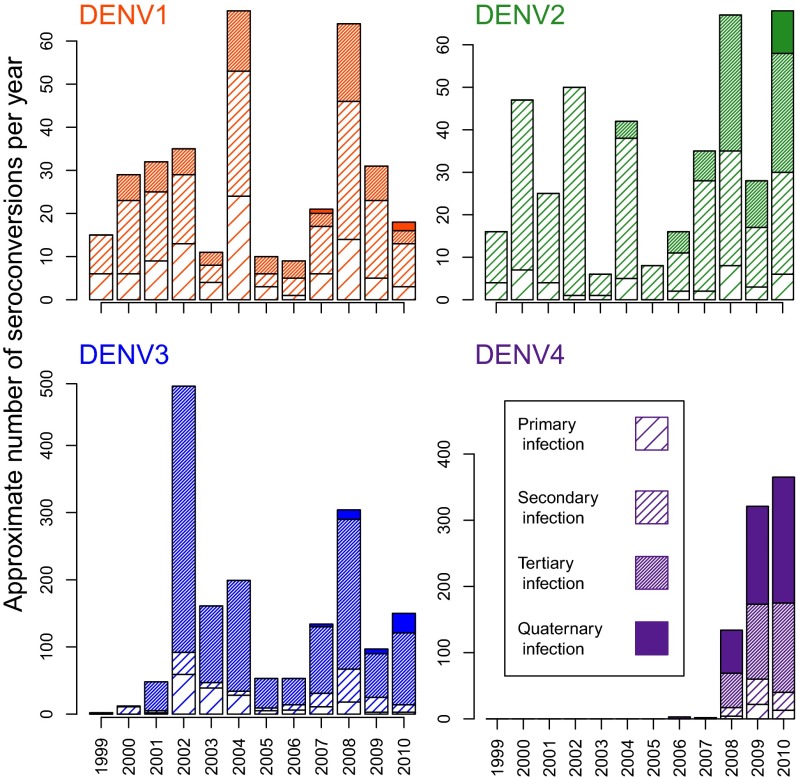
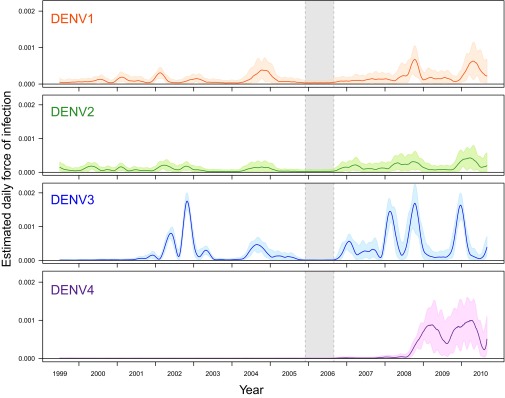
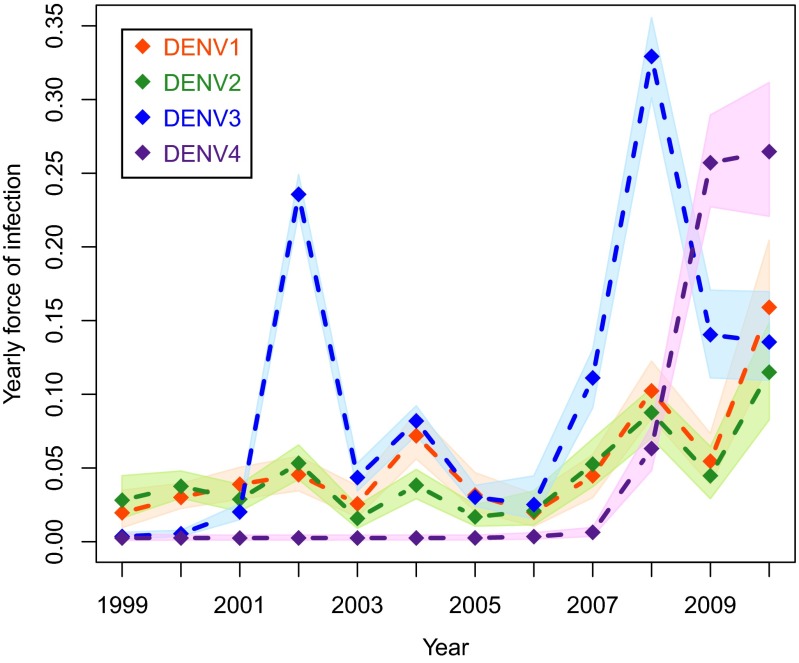
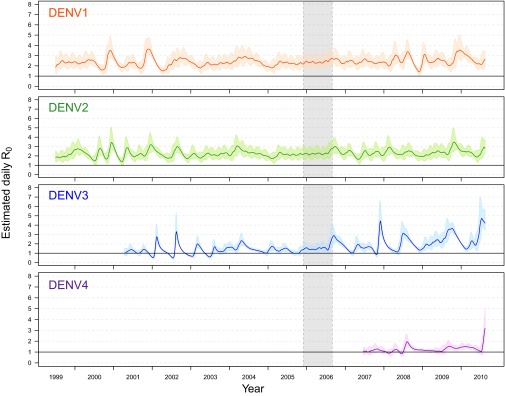
Infectious disease models play a key role in public health planning. These models rely on accurate estimates of key transmission parameters such as the force of infection (FoI), which is the per-capita risk of a susceptible person being infected. The FoI captures the fundamental dynamics of transmission and is crucial for gauging control efforts, such as identifying vaccination targets. Dengue virus (DENV) is a mosquito-borne, multiserotype pathogen that currently infects ∼390 million people a year. Existing estimates of the DENV FoI are inaccurate because they rely on the unrealistic assumption that risk is constant over time. Dengue models are thus unreliable for designing vaccine deployment strategies. Here, we present to our knowledge the first time-varying (daily), serotype-specific estimates of DENV FoIs using a spline-based fitting procedure designed to examine a 12-y, longitudinal DENV serological dataset from Iquitos, Peru (11,703 individuals, 38,416 samples, and 22,301 serotype-specific DENV infections from 1999 to 2010). The yearly DENV FoI varied markedly across time and serotypes (0-0.33), as did daily basic reproductive numbers (0.49-4.72). During specific time periods, the FoI fluctuations correlated across serotypes, indicating that different DENV serotypes shared common transmission drivers. The marked variation in transmission intensity that we detected indicates that intervention targets based on one-time estimates of the FoI could underestimate the level of effort needed to prevent disease. Our description of dengue virus transmission dynamics is unprecedented in detail, providing a basis for understanding the persistence of this rapidly emerging pathogen and improving disease prevention programs.
Keywords: arthropod-borne virus; disease ecology; emerging infections.
Conflict of interest statement
The authors declare no conflict of interest.
Figures
Comment in
-
How season and serotype determine dengue transmissibility.Proc Natl Acad Sci U S A. 2014 Jul 1;111(26):9370-1. doi: 10.1073/pnas.1407648111. Epub 2014 Jun 9. Proc Natl Acad Sci U S A. 2014. PMID: 24927557 Free PMC article. No abstract available.
References
-
- Muench H. Derivation of rates from summation data by the catalytic curve. J Am Stat Assoc. 1934;29(185):25–38.
-
- Hens N, et al. Seventy-five years of estimating the force of infection from current status data. Epidemiol Infect. 2010;138(6):802–812. - PubMed
-
- Anderson R, May R. Infectious Diseases of Humans: Dynamics and Control. Oxford Univ Press, Oxford; 1992.
Publication types
MeSH terms
Grants and funding
LinkOut - more resources
Full Text Sources
Other Literature Sources
Medical
