

Precise estimates of mutation rate and spectrum in yeast
- PMID: 24847077
- PMCID: PMC4050626
- DOI: 10.1073/pnas.1323011111
Precise estimates of mutation rate and spectrum in yeast
Abstract
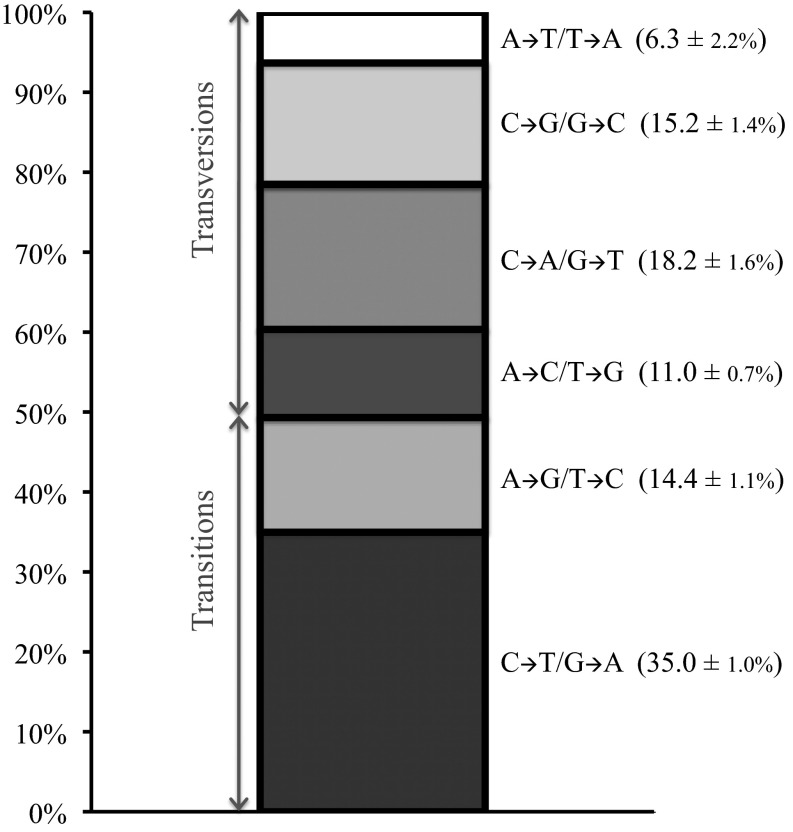
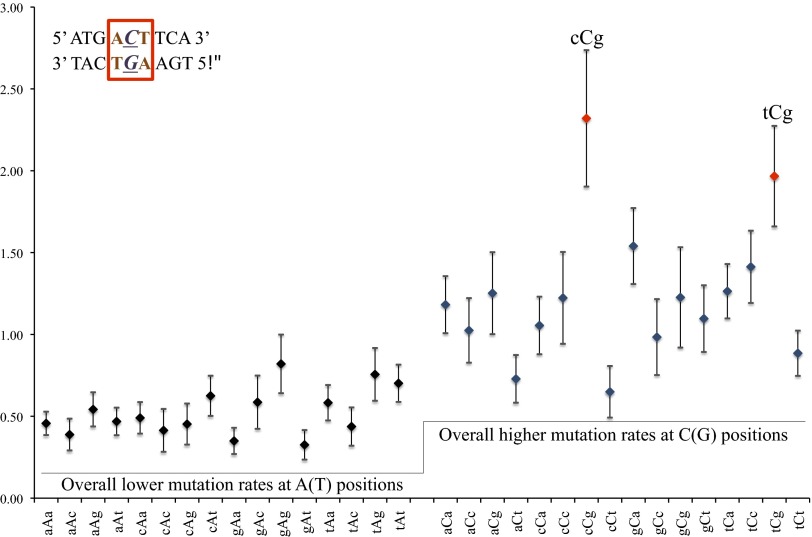
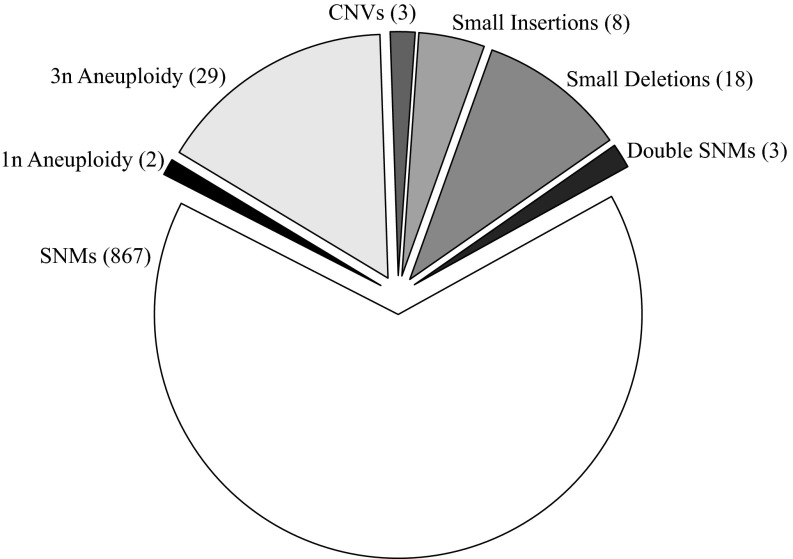
Mutation is the ultimate source of genetic variation. The most direct and unbiased method of studying spontaneous mutations is via mutation accumulation (MA) lines. Until recently, MA experiments were limited by the cost of sequencing and thus provided us with small numbers of mutational events and therefore imprecise estimates of rates and patterns of mutation. We used whole-genome sequencing to identify nearly 1,000 spontaneous mutation events accumulated over ∼311,000 generations in 145 diploid MA lines of the budding yeast Saccharomyces cerevisiae. MA experiments are usually assumed to have negligible levels of selection, but even mild selection will remove strongly deleterious events. We take advantage of such patterns of selection and show that mutation classes such as indels and aneuploidies (especially monosomies) are proportionately much more likely to contribute mutations of large effect. We also provide conservative estimates of indel, aneuploidy, environment-dependent dominant lethal, and recessive lethal mutation rates. To our knowledge, for the first time in yeast MA data, we identified a sufficiently large number of single-nucleotide mutations to measure context-dependent mutation rates and were able to (i) confirm strong AT bias of mutation in yeast driven by high rate of mutations from C/G to T/A and (ii) detect a higher rate of mutation at C/G nucleotides in two specific contexts consistent with cytosine methylation in S. cerevisiae.
Keywords: neighbor-dependent mutation rate; strongly deleterious mutation.
Conflict of interest statement
The authors declare no conflict of interest.
Figures


Comment in
-
Reply to Chen and Zhang: On interpreting genome-wide trends from yeast mutation accumulation data.Proc Natl Acad Sci U S A. 2014 Sep 30;111(39):E4063. doi: 10.1073/pnas.1413861111. Epub 2014 Sep 12. Proc Natl Acad Sci U S A. 2014. PMID: 25217565 Free PMC article. No abstract available.
-
Yeast mutation accumulation experiment supports elevated mutation rates at highly transcribed sites.Proc Natl Acad Sci U S A. 2014 Sep 30;111(39):E4062. doi: 10.1073/pnas.1412284111. Epub 2014 Sep 12. Proc Natl Acad Sci U S A. 2014. PMID: 25217566 Free PMC article. No abstract available.
References
-
- Ellegren H, Smith NG, Webster MT. Mutation rate variation in the mammalian genome. Curr Opin Genet Dev. 2003;13(6):562–568. - PubMed
-
- Ochman H. Neutral mutations and neutral substitutions in bacterial genomes. Mol Biol Evol. 2003;20(12):2091–2096. - PubMed
-
- Duret L, Galtier N. Biased gene conversion and the evolution of mammalian genomic landscapes. Annu Rev Genomics Hum Genet. 2009;10:285–311. - PubMed
-
- Kousathanas A, Oliver F, Halligan DL, Keightley PD. Positive and negative selection on noncoding DNA close to protein-coding genes in wild house mice. Mol Biol Evol. 2011;28(3):1183–1191. - PubMed
Publication types
MeSH terms
Grants and funding
LinkOut - more resources
Full Text Sources
Other Literature Sources
Molecular Biology Databases
