. 2014 Jun;6(3):240-54.
doi: 10.1093/jmcb/mju016. Epub 2014 May 20.

Aurora A orchestrates entosis by regulating a dynamic MCAK-TIP150 interaction

Affiliations

Aurora A orchestrates entosis by regulating a dynamic MCAK-TIP150 interaction

Peng Xia et al. J Mol Cell Biol. 2014 Jun.

Abstract

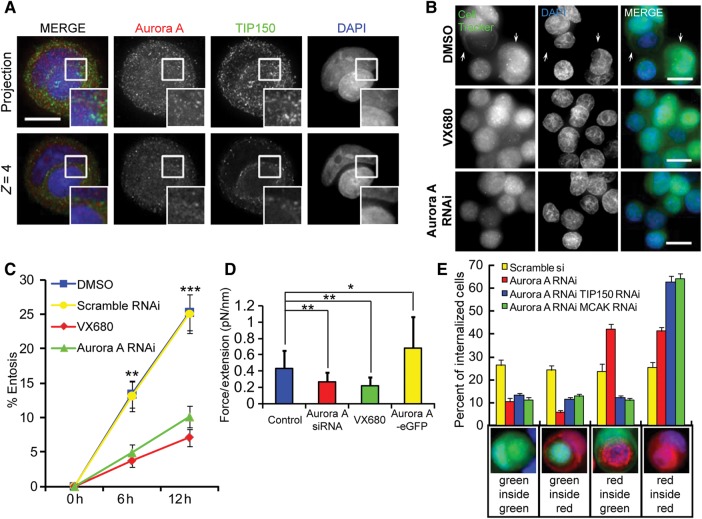
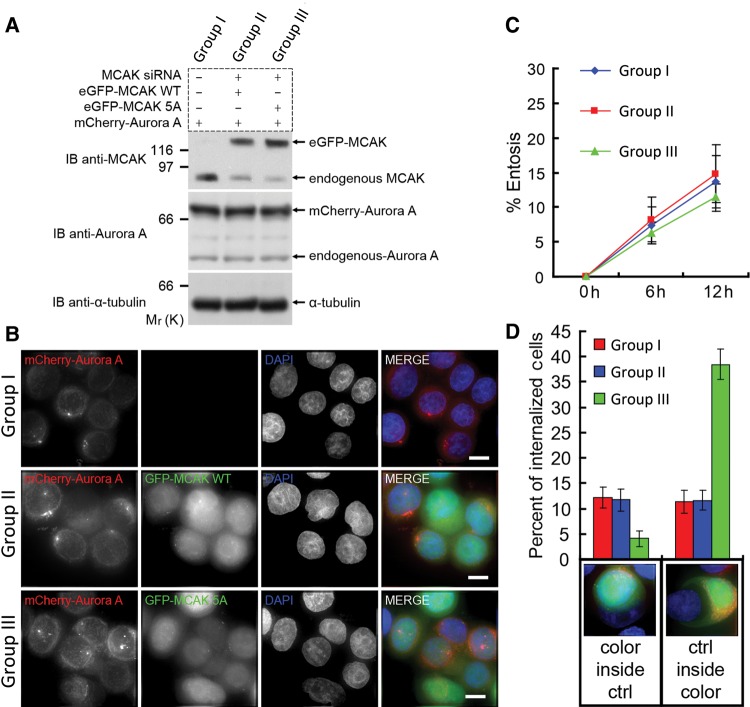
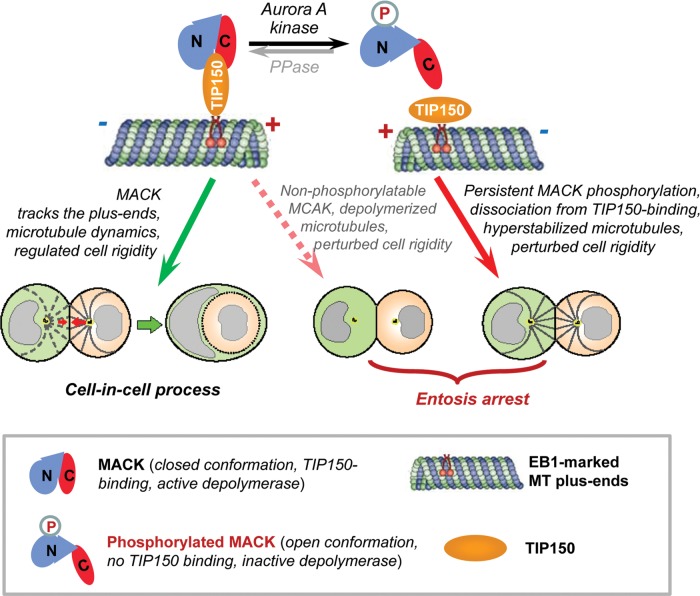
Entosis, a cell-in-cell process, has been implicated in the formation of aneuploidy associated with an aberrant cell division control. Microtubule plus-end-tracking protein TIP150 facilitates the loading of MCAK onto the microtubule plus ends and orchestrates microtubule plus-end dynamics during cell division. Here we show that TIP150 cooperates with MCAK to govern entosis via a regulatory circuitry that involves Aurora A-mediated phosphorylation of MCAK. Our biochemical analyses show that MCAK forms an intra-molecular association, which is essential for TIP150 binding. Interestingly, Aurora A-mediated phosphorylation of MCAK modulates its intra-molecular association, which perturbs the MCAK-TIP150 interaction in vitro and inhibits entosis in vivo. To probe if MCAK-TIP150 interaction regulates microtubule plasticity to affect the mechanical properties of cells during entosis, we used an optical trap to measure the mechanical rigidity of live MCF7 cells. We find that the MCAK cooperates with TIP150 to promote microtubule dynamics and modulate the mechanical rigidity of the cells during entosis. Our results show that a dynamic interaction of MCAK-TIP150 orchestrated by Aurora A-mediated phosphorylation governs entosis via regulating microtubule plus-end dynamics and cell rigidity. These data reveal a previously unknown mechanism of Aurora A regulation in the control of microtubule plasticity during cell-in-cell processes.

Keywords: Aurora A; MCAK; TIP150; entosis; kinesin; microtubule plus-end.


Figures

Figure 1
Figure 1
Microtubule plus-end-tracking protein TIP150 is required for cell-in-cell process. (A) MCF7 cells were fixed and stained with DAPI and α-tubulin antibody after 6 h of suspension culture in the presence of DMSO (control), 33 μM or 100 nM nocodazole, or 1 μM taxol. Arrows indicate internalized cells. The scale bars are 15 μm. (B) Quantification of internalizing cells after 6 h suspension culture treated with DMSO, nocodazole, or taxol. The rate of entosis is decreased in cells treated with either nocodazole or taxol. Error bars indicate SD for three independent experiments in which at least 600 cells were quantified for each experiment. **P < 0.01. (C) Images of MCF7 cells transfected with scramble or TIP150 siRNA. Cells were labeled with CellTracker Green and fixed after 6 h of suspension culture. Arrows indicate internalized cells. The scale bars are 15 μm. (D) Quantification of internalizing cells at 6 and 12 h. Knockdown of TIP150 reduces the rate of entosis of MCF7 cells. Data are means ± SD. Each point represents at least 600 cells analyzed over three independent experiments. **P < 0.01. (E) Time-lapse imaging of EB1-GFP-stable MCF7 cells transiently transfected with scramble or TIP150 shRNA. Locations of the shRNAs are indicated by co-expression with CENP-B-mCherry. The scale bars are 15 μm. Enlarged insets are shown in grayscale. Time in seconds is shown in the top left corner. Growing and pausing/shrinking MT plus-ends are indicated with arrows and arrowheads, respectively. The frequency of plus-ends catastrophe is decreased by TIP150 knockdown. (F and G) Histograms of MT plus-ends tracking velocity and catastrophe frequency in scramble or TIP150 shRNA-expressing cells (for each condition, at least 900 microtubule plus-ends in 30 cells from three independent experiments were analyzed). Error bars indicate SD. *P < 0.05.
Figure 2
Figure 2
Interaction of TIP150 with MCAK is essential for entosis. (A) MCF7 cells transfected with scramble, MCAK, or MCAK and TIP150 siRNAs were labeled with CellTracker Green and fixed after 6 h of suspension culture. Arrows indicate internalized cells. The scale bars are 15 μm. (B) Quantification of internalizing cells transfected with scramble, MCAK, or MCAK and TIP150 siRNAs at 6 and 12 h. MCAK RNA interference has a similar but not a synergistic effect with TIP150 knockdown. Data are means ± SD. Each point represents at least 400 cells analyzed over three independent experiments. **P < 0.01. (C) Images of GFP, TIP150-GFP, or MCAK-GFP stable cells after 6 h of suspension culture. Arrows indicate internalized cells. The scale bars are 15 μm. (D) Quantification of cell-in-cell process as a function of time. Overexpression of TIP150/MCAK but not EB1 reduces the entosis rate. Data are means ± SD. Each point represents at least 400 cells analyzed over three independent experiments. **P < 0.01. (E) Percent of dual-color labeled internalizing cells after 6 h of suspension culture. Red-labeled control cells were mixed 1:1 with green-labeled cells transfected with scramble, MCAK, or MCAK and TIP150 siRNAs. Below the x-axis are examples of different color combinations. Data are means ± SD for three independent experiments in which at least 600 cells were quantified for each experiment. (F) Percent of dual-color labeled internalizing cells after 6 h of suspension culture. Red-labeled control cells were mixed 1:1 with cells stably expressing GFP, TIP150-GFP, or MCAK-GFP. Below the x-axis are examples of different color combinations. TIP150/MCAK overexpressing cells tend to be invaded by control cells. Data are means ± SD for three independent experiments in which at least 600 cells were quantified for each experiment. (G) Sketch of stretching a cell by optical tweezers. A handle bead adhering to a cell is trapped by the optical tweezer. When the coverslip is moving with a velocity v, the cell adhering to the coverslip will be stretched by trapping force F, which is induced by the bead's deviation Δx from the trap center. In a given time interval t, the cell (dash curve) moves a distance vt. The length of l = vt−Δx denotes the stretching extension under F. The dependence of F to l can denote cell rigidity. (H and I) Example of optical trap experiments shows a cell with low rigidity (H) deformed and a cell with high rigidity (I) difficult to be deformed. The bead adhered on the cell is trapped by the optical tweezer. The range of the optical tweezer was indicated with arrowhead. The scale bars are 5 μm. (J) Analysis of the dependence of F (trapping force) to l (stretching extension) shows inner cell has higher cell rigidity than outer cell in paired entosis cells. Data are means ± SD. *P < 0.05. See also Supplementary Figure S4A. (K) Analysis of the dependence of F (trapping force) to l (stretching extension) shows cells transfected with TIP150/MCAK siRNA have increased cell rigidity, while cells stably expressing TIP150/MCAK-eGFP have decreased cell rigidity. Data are means ± SD. *P < 0.05. See also Supplementary Figure S4B–E. (L) Analysis of the dependence of F (trapping force) to l (stretching extension) shows cells treated with paclitaxel have increased cell rigidity, while cells treated with nocodazole exhibit decreased cell rigidity. Data are means ± SD. **P < 0.01. See also Supplementary Figure S4F–H.
Figure 3
Figure 3
Aurora A phosphorylation perturbs MCAK–TIP150 interaction. (A) Images of MCAK-GFP or TIP150-GFP stable cells transfected with or without TIP150 shRNA or MCAK siRNA. The scale bars are 15 μm. Enlarged insets are trails (TRL) of 31 frames with 3-sec intervals. (B and C) Histograms of MT plus-ends comet lengths, or fluorescence intensity ratios at the growing MT tips and in surrounding cytoplasm of indicated cells (for each condition, at least 900 microtubule plus-ends in 30 cells from three independent experiments were analyzed); error bars indicate SD, **P < 0.01; NS, P > 0.05. (D) Schematic diagram of TIP150 domains. Full-length TIP150 is divided into TIP150-N (1–800 aa) and TIP150-C (801–1368 aa). (E) Schematic diagram of MCAK domains. Full-length MCAK is divided into MCAK-N (1–586 aa) and MCAK-C (587–725 aa). The phosphorylation sites (S95/109/111/115/192, 5S for short) of Aurora kinase are located at the globular domain of MCAK. (F) Validation of MCAK 5S phosphorylation by Aurora A. Purified 6×His (H6)-GFP-MCAK-N and 5S mutant 5A (1 μg) were incubated with 50 μM ATP, with or without recombinant Aurora A kinase (50 ng). Anti-phosphoserine antibody blotting (upper); CBB staining (lower). (G) GST-TIP150-C and GST proteins were used as affinity matrices to absorb GFP-tagged wild-type MCAK and mutants. Binding activity was examined by anti-GFP blotting. TIP150-C bound to MCAK wild-type and the 5A mutant but less to the 5E mutant. (H) Beads with bound Flag-MCAK-N were used as affinity matrices to absorb GFP-TIP150 proteins from soluble 293 T cell lysates with or without purified H6-MCAK-C. Binding activity was analyzed by anti-GFP blotting (upper). Flag-MCAK-N was analyzed by anti-Flag blotting (lower). (I) Beads with bound Flag-MCAK-N were used as affinity matrices to absorb GFP-MCAK-C or GFP proteins from soluble 293T cell lysates. Binding activity was analyzed by anti-GFP blotting (upper). Flag-MCAK-N was analyzed by anti-Flag blotting (lower). (J) Binding activity assay for GST-MCAK-C to purified H6-GFP-MCAK-N WT/5A/5E. The input and bound proteins were analyzed by SDS–PAGE and CBB staining. Quantitatively, MCAK-C binds tighter to MCAK-N WT and 5A than to the 5E mutant (see also Supplementary Figure S6). (K) Molecular mechanism accounting for the MCAK–TIP150 interaction and MT plus-end tracking.
Figure 4
Figure 4
Aurora A-elicited phosphorylation-mimicking mutants of MCAK promote entosis. (A) Live cell images of cells stably expressing the eGFP-tagged MCAK-5A or -5E mutant transiently transfected with or without TIP150 shRNA. Locations of the shRNAs were indicated by co-expressing with CENP-B-mCherry. Enlarged insets are trails (TRL) of 31 frames with 3-sec intervals and shown in grayscale. Knockdown of TIP150 weakens plus-end tracking of MCAK-5A, but MCAK-5E has no MT tracking activity whether expression of TIP150 is depressed or not. The scale bars are 15 μm. (B) Histograms of MT plus-end comet lengths in indicated cells (for each condition, at least 900 microtubule plus-ends in 30 cells from three independent experiments were analyzed); error bars indicate SD. **P < 0.01; N.A., not available. (C) Ratio of fluorescence intensities at the growing MT tips and in surrounding cytoplasm of indicated cells (for each condition, at least 900 microtubule plus-ends in 30 cells from three independent experiments were analyzed); error bars indicate SD. **P < 0.01; N.A., not available. (D) Images of MCAK-5A/5E-GFP stable cells after 6 h of suspension culture. Arrows indicate internalized cells. The scale bars are 15 μm. (E) Quantification of internalizing cells expressing MCAK-5A/5E-GFP at 6 and 12 h. Overexpression of MCAK-5A but not MCAK-5E results in decreased entosis, suggesting that Aurora A-elicited phosphorylation of MCAK promotes entosis. Data expressed as means ± SD. Each point represents at least 600 cells analyzed over three independent experiments. **P < 0.01. (F) Percent of dual-color labeled internalizing cells after 6 h of suspension culture. Red-labeled control cells were mixed 1:1 with MCAK-5A/5E-GFP stable cells. Below the x-axis are examples of different color combinations. Note that cells overexpressing MCAK-5A but not -5E tend to be invaded by control cells. But after being transiently transfected with TIP150 siRNA, both MCAK-5A and -5E cells essentially did not invade and were not invaded by control cells. Data expressed as means ± SD for three independent experiments in which at least 600 cells were quantified for each experiment.
Figure 5
Figure 5
Dynamic regulation of Aurora A kinase activity is necessary for entosis to proceed. (A) Immunofluorescence staining of TIP150 and Aurora A in entotic MCF7cells. Up-panel, images are projections of 12 Z-stack frames with 1-μm intervals (see Supplementary Figure S8 for single-frame tomography); down-panel, the fifth single plan (4 μm from the bottom) of the same cell in up-panel. Inframe shows partial co-localization of TIP150 and Aurora A. The scale bar is 10 μm. (B) MCF7 cells treated with DMSO (control) or 1 μM Aurora kinase inhibitor VX680 or transfected with Aurora A siRNA were labeled with CellTracker Green and fixed after 6 h of suspension culture. Arrows indicate internalized cells. The scale bars are 15 μm. (C) Quantification of internalizing cells treated as in D at 6 and 12 h. Inhibition of Aurora A reduces the rate of entosis. Data are means ± SD. Each point represents at least 600 cells analyzed over three independent experiments. **P < 0.01. (D) Analysis of the dependence of F (trapping force) to l (stretching extension) shows cells transfected with Aurora A siRNA or treated with VX680 have decreased cell rigidity, while cells stably expressing Aurora A-eGFP have increased cell rigidity. Data are means ± SD. *P < 0.05, **P < 0.01. See also Supplementary Figure S10A–C. (E) Percent of dual-color labeled internalizing cells after 6 h culture in suspension culture. Red-labeled control cells were mixed 1:1 with green-labeled cells transfected with Scramble or Aurora A siRNA together with or without TIP150/MCAK siRNA. Below the x-axis are examples of different color combinations. Cells with individual knockdown of Aurora A tended to be invaded by control cells. But with double knockdown of Aurora A and MCAK or TIP150, cells did not invade and were not invaded by control cells. Data are means ± SD for three independent experiments in which at least 600 cells were quantified for each experiment.
Figure 6
Figure 6
Aurora A orchestrates entosis in a MCAK-dependent manner. (A) Assessment of exogenous protein expression levels. GROUP I is MCF7 cell transient transfected with mCherry-Aurora A; GROUP II is eGFP-MCAK-WT stable MCF7 cell line transfected with mCherry-Aurora A and MCAK siRNA targeting 3′-UTR; GROUP III is eGFP-MCAK-5A stable cell line transfected with mCherry-Aurora A and MCAK siRNA. Protein levels of exogenously expressed GFP-MCAK, mCherry-Aurora A, and endogenous MCAK and Aurora A in the three groups were judged by immunoblotting with anti-MCAK and anti-Aurora A antibodies, respectively. (B) Aliquots of cells from the aforementioned three groups were suspended and incubated for 6 h to induce homotypic cell-in-cell process before centrifugation and formaldehyde fixation. The scale bar is 10 μm. (C) Quantification of entosis cells treated as in B at 6 and 12 h. All three groups exhibit reduced rates of cell-in-cell processes. Data are means ± SD. Each point represents at least 400 cells analyzed over three independent experiments. Differences between the three groups are not significant. (D) Aliquots of the aforementioned three groups of cells expressing various exogenously marked proteins were individually mixed 1:1 with un-transfected MCF7 (control) cells and incubated suspended to allow the process of cell-in-cell for 6 h. Treated cells were then fixed and stained with DAPI to mark nucleus for annotation of entosis. Below the x-axis are examples of different color combinations. Overexpression of Aurora A in the presence of wild type inhibits target cells invading or being invaded by control cells, but the non-phosphorylatable MCAK mutant can override the effect of Aurora A overexpression, resulting in increasing of target cells invaded by control cells. GROUP III cells tended to be invaded by control cells, but GROUP I and II cells did not. Data are means ± SD for three independent experiments in which at least 600 cells were quantified for each experiment.
Figure 7
Figure 7
Schematic model accounting for Aurora A–MCAK–TIP150 axis during entosis. Microtubule depolymerase MCAK binds to TIP150 by which it tracks microtubule plus-end for regulating microtubule plus-end dynamics and cell rigidity during entosis. Aurora A interacts with and phosphorylates the N-terminal MCAK to release its intra-molecular N-C association by which MCAK–TIP150 interaction is abolished. In this case, Aurora A-phosphorylated MCAK is no longer associated with microtubule plus-end via TIP150 to exerts its depolymerase activity by which microtubule plus-ends become static and cell rigidity regulation is perturbed. It should be noted that MCAK phosphorylation is dynamically regulated either by phosphorylation/dephosphorylation cycle or by spatial separation of enzyme-substrate contact. The identity of the phosphatase underlying entosis is unclear. On the other hand, non-phosphorylatable MCAK exhibits greater microtubule depolymerase activity which results in perturbed cell rigidity. The perturbation of cell rigidity by either hyperstabilization of microtubules or destabilization of microtubules harnesses the progression of entosis. Thus, dynamic interaction of MCAK–TIP150 orchestrated by Aurora A phosphorylation is essential for entosis.

Similar articles

Cited by

References

    1. Abodief W.T., Dey P., Al-Hattab O. Cell cannibalism in ductal carcinoma of breast. Cytopathology. 2006;17:304–305. - PubMed
    1. Akhmanova A., Steinmetz M.O. Tracking the ends: a dynamic protein network controls the fate of microtubule tips. Nat. Rev. Mol. Cell Biol. 2008;9:309–322. - PubMed
    1. Andrews P.D., Ovechkina Y., Morrice N., et al. Aurora B regulates MCAK at the mitotic centromere. Dev. Cell. 2004;6:253–268. - PubMed
    1. Borghi N., Sorokina M., Shcherbakova O.G., et al. E-cadherin is under constitutive actomyosin-generated tension that is increased at cell-cell contacts upon externally applied stretch. Proc. Natl Acad. Sci. USA. 2012;109:12568–12573. - PMC - PubMed
    1. Buosciolo A., Pesce G., Sasso A. New calibration method for position detector for simultaneous measurements of force constants and local viscosity in optical tweezers. Opt. Commun. 2004;230:357–368.

Publication types