

Learning-induced uncertainty reduction in perceptual decisions is task-dependent
- PMID: 24847237
- PMCID: PMC4019845
- DOI: 10.3389/fnhum.2014.00282
Learning-induced uncertainty reduction in perceptual decisions is task-dependent
Abstract
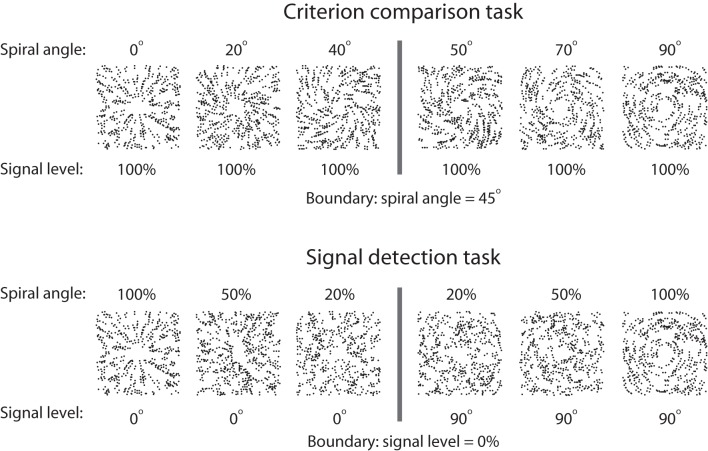
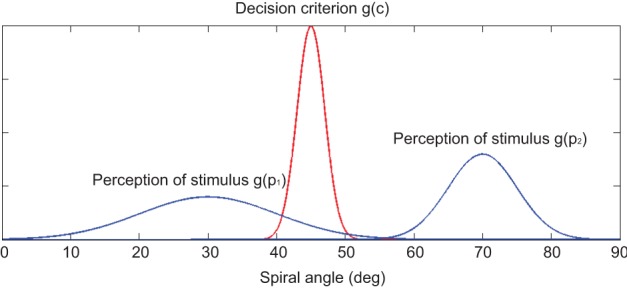
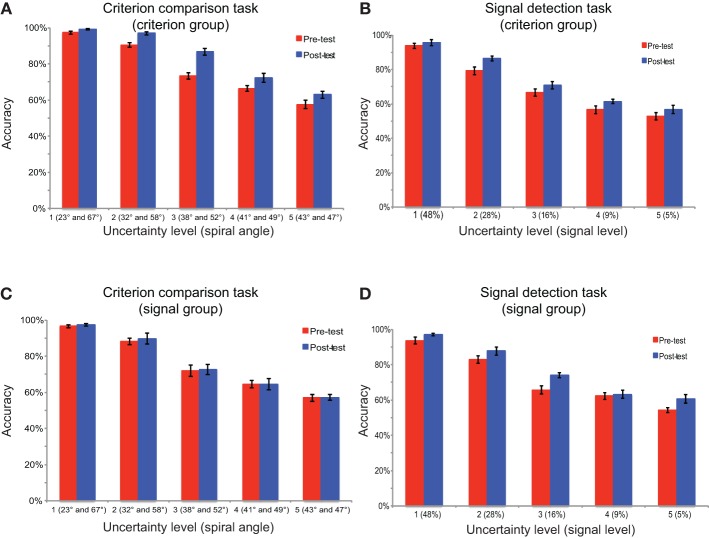
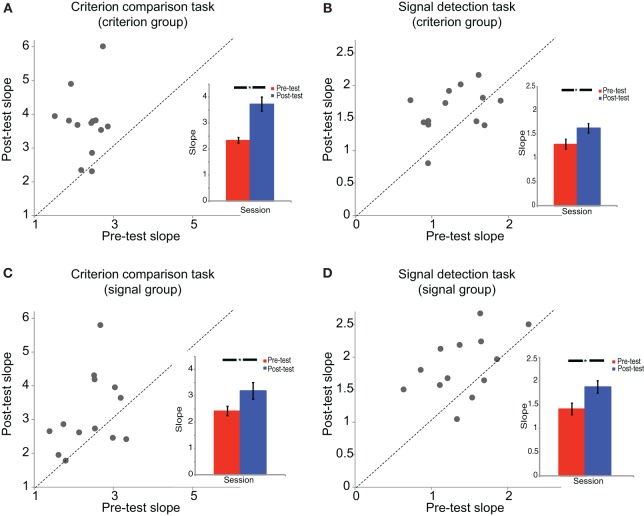
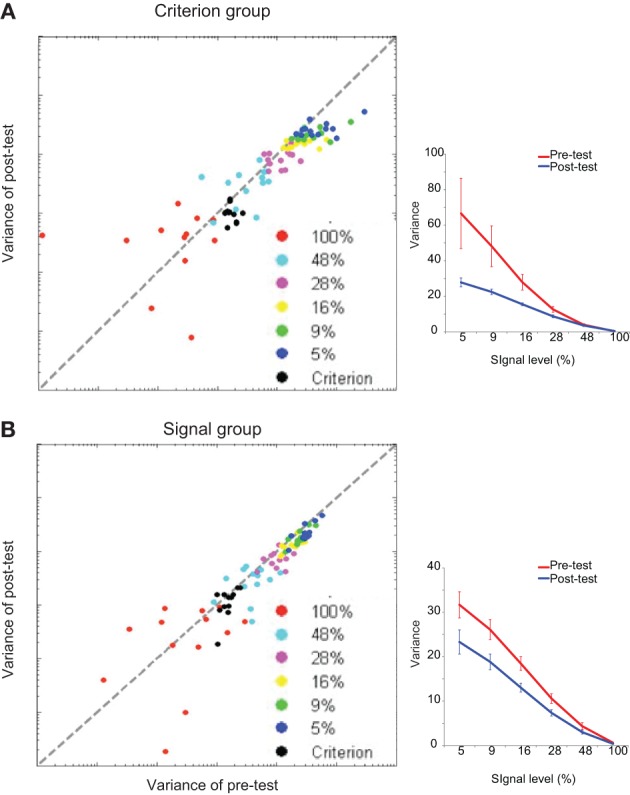
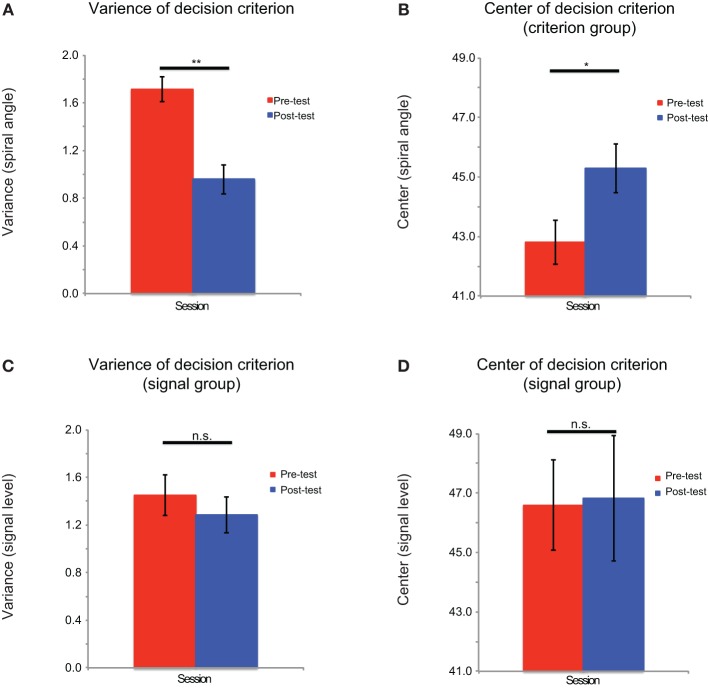
Perceptual decision-making in which decisions are reached primarily from extracting and evaluating sensory information requires close interactions between the sensory system and decision-related networks in the brain. Uncertainty pervades every aspect of this process and can be considered related to either the stimulus signal or decision criterion. Here, we investigated the learning-induced reduction of both the signal and criterion uncertainty in two perceptual decision tasks based on two Glass pattern stimulus sets. This was achieved by manipulating spiral angle and signal level of radial and concentric Glass patterns. The behavioral results showed that the participants trained with a task based on criterion comparison improved their categorization accuracy for both tasks, whereas the participants who were trained on a task based on signal detection improved their categorization accuracy only on their trained task. We fitted the behavioral data with a computational model that can dissociate the contribution of the signal and criterion uncertainties. The modeling results indicated that the participants who were trained on the criterion comparison task reduced both the criterion and signal uncertainty. By contrast, the participants who were trained on the signal detection task only reduced their signal uncertainty after training. Our results suggest that the signal uncertainty can be resolved by training participants to extract signals from noisy environments and to discriminate between clear signals, which are evidenced by reduced perception variance after both training procedures. Conversely, the criterion uncertainty can only be resolved by the training of fine discrimination. These findings demonstrate that uncertainty in perceptual decision-making can be reduced with training but that the reduction of different types of uncertainty is task-dependent.
Keywords: Glass pattern; categorization; learning; perceptual decision; uncertainty.
Figures
Similar articles
-
Task-dependent uncertainty modulation of perceptual decisions in the human brain.Eur J Neurosci. 2012 Dec;36(12):3732-9. doi: 10.1111/ejn.12006. Epub 2012 Oct 4. Eur J Neurosci. 2012. PMID: 23033853
-
Stimulus uncertainty and relative reward rates determine adaptive responding in perceptual decision-making.PLoS Comput Biol. 2025 May 27;21(5):e1012636. doi: 10.1371/journal.pcbi.1012636. eCollection 2025 May. PLoS Comput Biol. 2025. PMID: 40424292 Free PMC article.
-
Suboptimal Criterion Learning in Static and Dynamic Environments.PLoS Comput Biol. 2017 Jan 3;13(1):e1005304. doi: 10.1371/journal.pcbi.1005304. eCollection 2017 Jan. PLoS Comput Biol. 2017. PMID: 28046006 Free PMC article.
-
Toward a unified theory of decision criterion learning in perceptual categorization.J Exp Anal Behav. 2002 Nov;78(3):567-95. doi: 10.1901/jeab.2002.78-567. J Exp Anal Behav. 2002. PMID: 12507020 Free PMC article. Review.
-
Different types of uncertainty in multisensory perceptual decision making.Philos Trans R Soc Lond B Biol Sci. 2023 Sep 25;378(1886):20220349. doi: 10.1098/rstb.2022.0349. Epub 2023 Aug 7. Philos Trans R Soc Lond B Biol Sci. 2023. PMID: 37545308 Free PMC article. Review.
Cited by
-
Anodal Transcranial Direct Current Stimulation over the Right Dorsolateral Prefrontal Cortex Boosts Decision Making and Functional Impulsivity in Female Sports Referees.Life (Basel). 2023 May 5;13(5):1131. doi: 10.3390/life13051131. Life (Basel). 2023. PMID: 37240776 Free PMC article.
-
Interoception and symptom reporting: disentangling accuracy and bias.Front Psychol. 2015 Jun 4;6:732. doi: 10.3389/fpsyg.2015.00732. eCollection 2015. Front Psychol. 2015. PMID: 26089810 Free PMC article.
-
Neural Interactions in a Spatially-Distributed Cortical Network During Perceptual Decision-Making.Front Behav Neurosci. 2019 Sep 24;13:220. doi: 10.3389/fnbeh.2019.00220. eCollection 2019. Front Behav Neurosci. 2019. PMID: 31607873 Free PMC article.
References
LinkOut - more resources
Full Text Sources
Other Literature Sources