

Babies, soft drinks and snacks: a concern in low- and middle-income countries?
- PMID: 24847768
- PMCID: PMC4299489
- DOI: 10.1111/mcn.12126
Babies, soft drinks and snacks: a concern in low- and middle-income countries?
Abstract
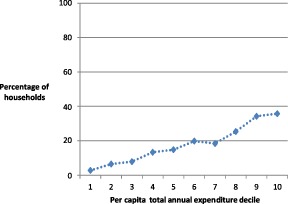
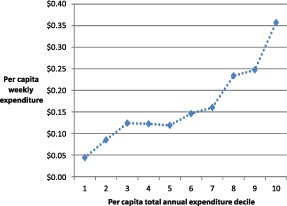
Undernutrition in infants and young children is a global health priority while overweight is an emerging issue. Small-scale studies in low- and middle-income countries have demonstrated consumption of sugary and savoury snack foods and soft drinks by young children. We assessed the proportion of children 6-23 months of age consuming sugary snack foods in 18 countries in Asia and Africa using data from selected Demographic and Health Surveys and household expenditures on soft drinks and biscuits using data from four Living Standards Measurement Studies (LSMS). Consumption of sugary snack foods increased with the child's age and household wealth, and was generally higher in urban vs. rural areas. In one-third of countries, >20% of infants 6-8 months consumed sugary snacks. Up to 75% of Asian children and 46% of African children consumed these foods in the second year of life. The proportion of children consuming sugary snack foods was generally higher than the proportion consuming fortified infant cereals, eggs or fruit. Household per capita daily expenditures on soft drinks ranged from $0.03 to $0.11 in three countries for which LSMS data were available, and from $0.01 to $0.04 on biscuits in two LSMS. Future surveys should include quantitative data on the purchase and consumption of snack foods by infants and young children, using consistent definitions and methods for identifying and categorising snack foods across surveys. Researchers should assess associations between snack food consumption and stunting and overweight, and characterise household, maternal and child characteristics associated with snack food consumption.
Keywords: child feeding; child public health; complementary feeding; complementary foods; infant and child nutrition; low-income countries.
© 2014 The Authors. Maternal & Child Nutrition published by John Wiley & Sons Ltd.
Conflict of interest statement
The authors declare that they have no conflicts of interest.
Figures
 ) Sugary foods, (
 ) infant formula, (
 ) fortified infant cereals, (
 ) eggs, (
 ) vitamin
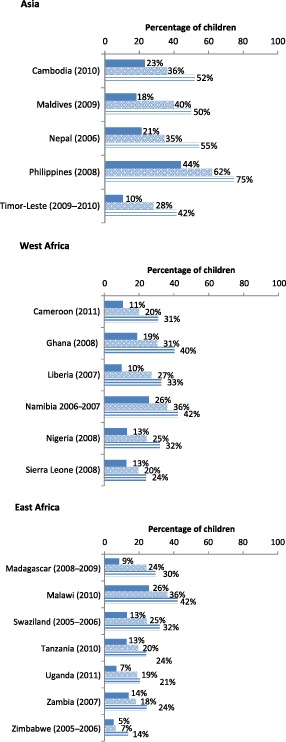
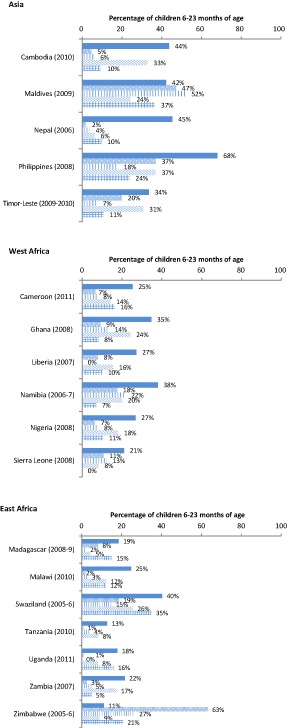
 ) 6–8 months, (
 ) 9–11 months, (
 ) 12–23 months. aThe percentage of children who consumed sugary foods differed significantly between ages 6–8 months and 12–23 months at P < 0.001 except for
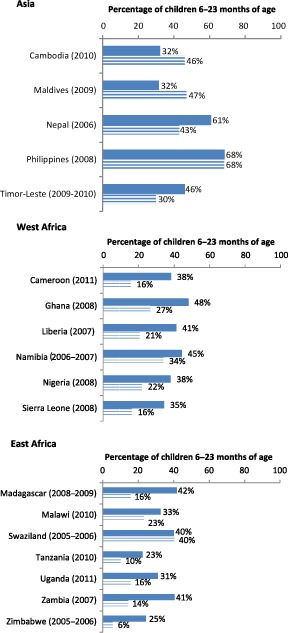
 )
)  ) rural. aThe percentage of children who consumed any sugary foods differed significantly by urban vs. rural residence at P < 0.001 except for
References
-
- Adair L.S. (2012) How could complementary feeding patterns affect the susceptibility to NCD later in life? Nutrition, Metabolism, and Cardiovascular Diseases 22, 765–769. - PubMed
-
- Banerjee A. & Duflo E. (2012) Poor Economics: A Radical Rethinking of the Way to Fight Global Poverty. Public Affairs: New York.
-
- Black R.E., Victora C.G., Walker S.P. & the Maternal and Child Nutrition Study Group (2013) Maternal and child undernutrition and overweight in low‐income and middle‐income countries. Lancet 382, 427–451. - PubMed
-
- Branca F. & Caroli M. (2012) Complementary feeding and dietary prevention of non‐communicable diseases – a gap in the life course approach? Nutrition, Metabolism, and Cardiovascular Diseases 22, 763–764. - PubMed
Publication types
MeSH terms
LinkOut - more resources
Full Text Sources
Other Literature Sources
Medical
