. 2014 Jul 3;511(7507):94-8.
doi: 10.1038/nature13297. Epub 2014 May 21.

Anti-diabetic activity of insulin-degrading enzyme inhibitors mediated by multiple hormones

Affiliations

Anti-diabetic activity of insulin-degrading enzyme inhibitors mediated by multiple hormones

Juan Pablo Maianti et al. Nature. .

Abstract

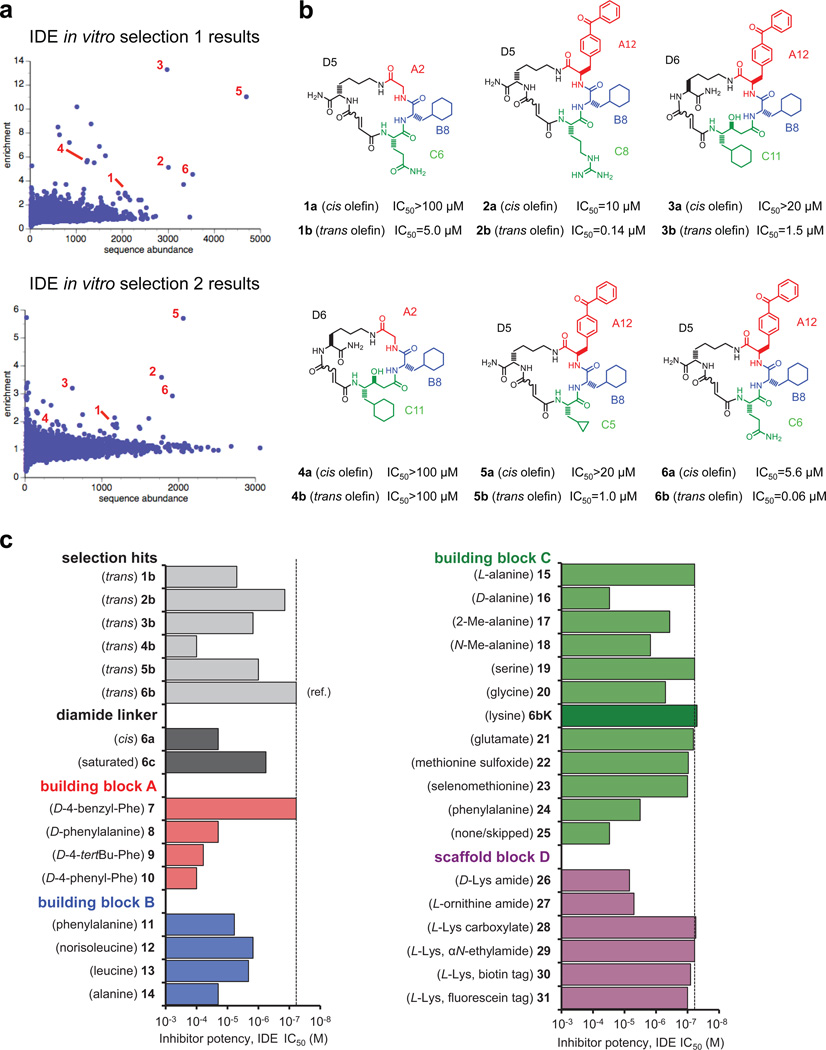
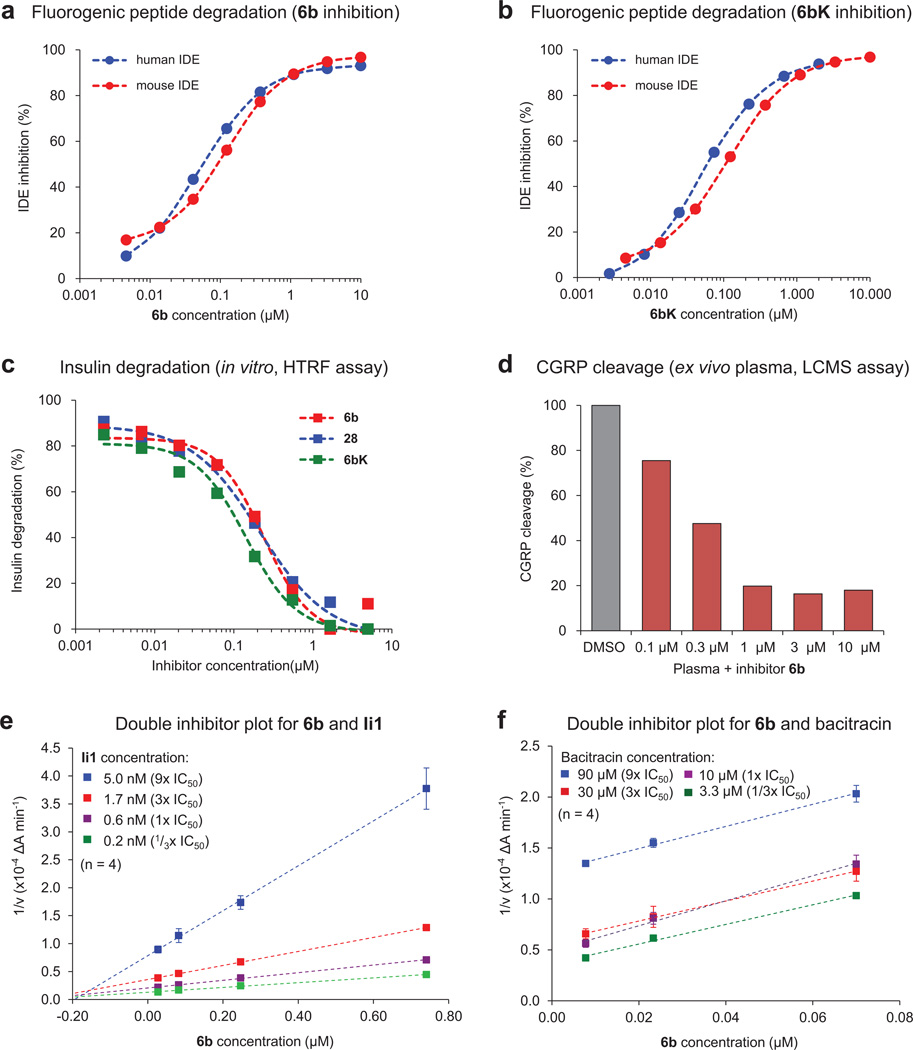
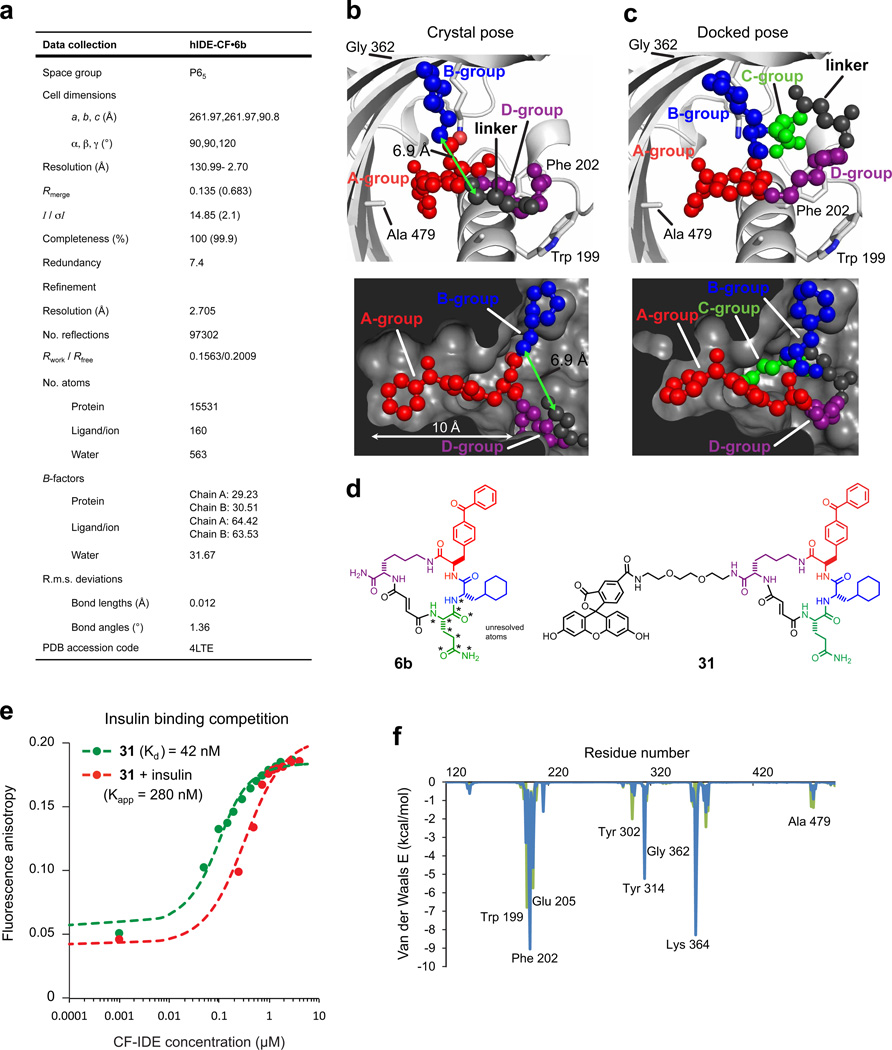
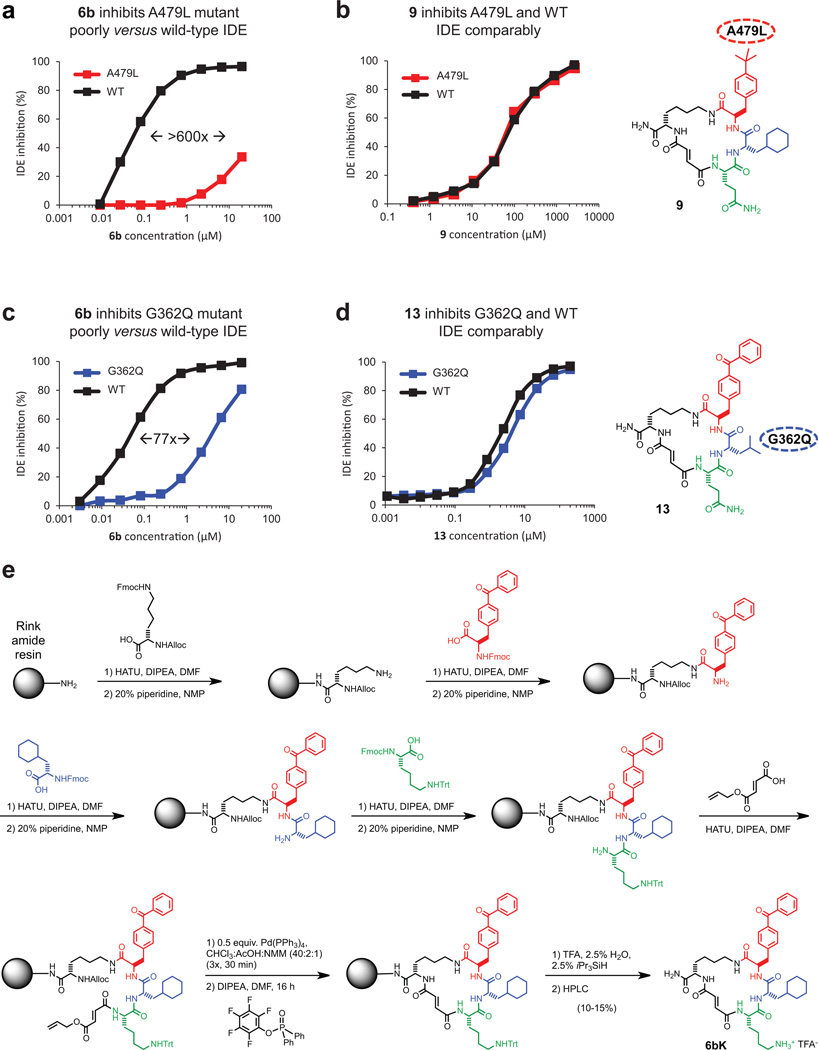
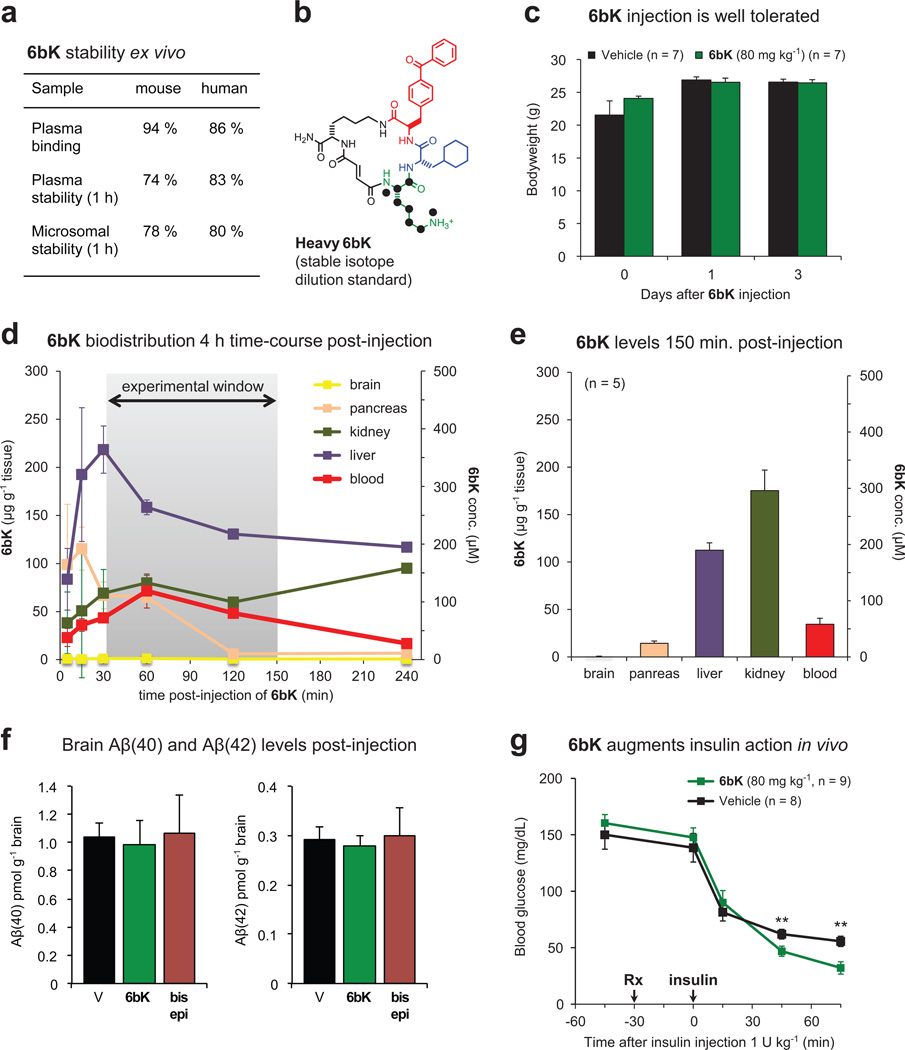
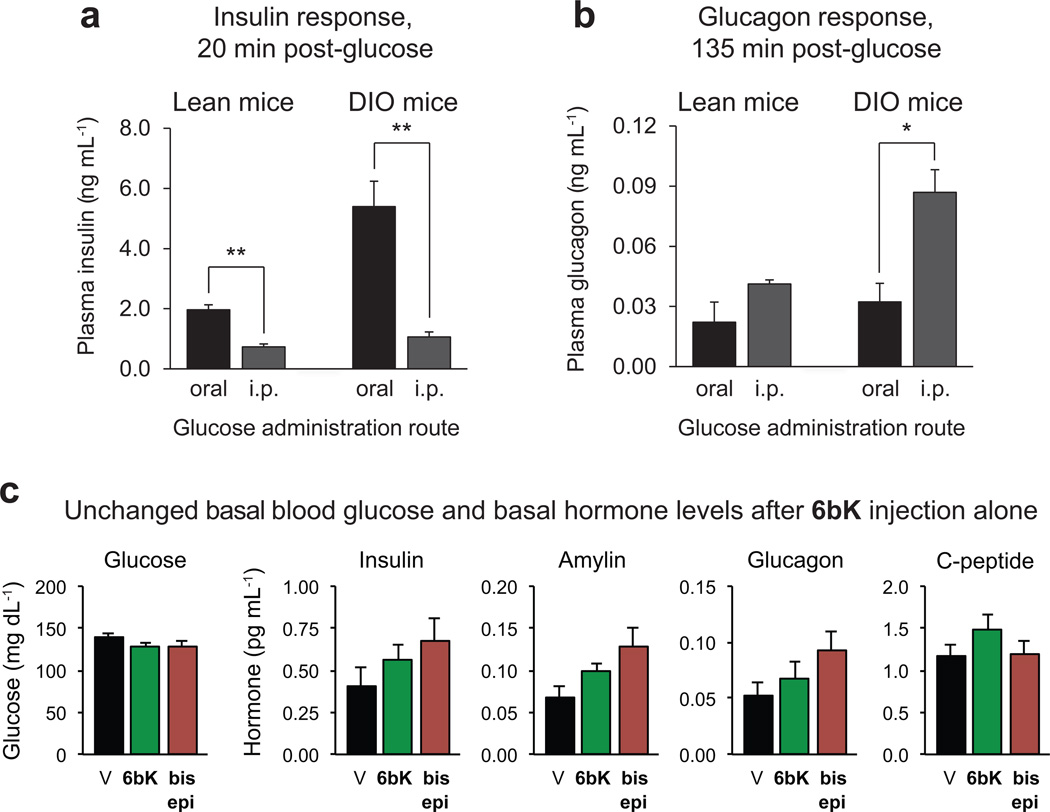
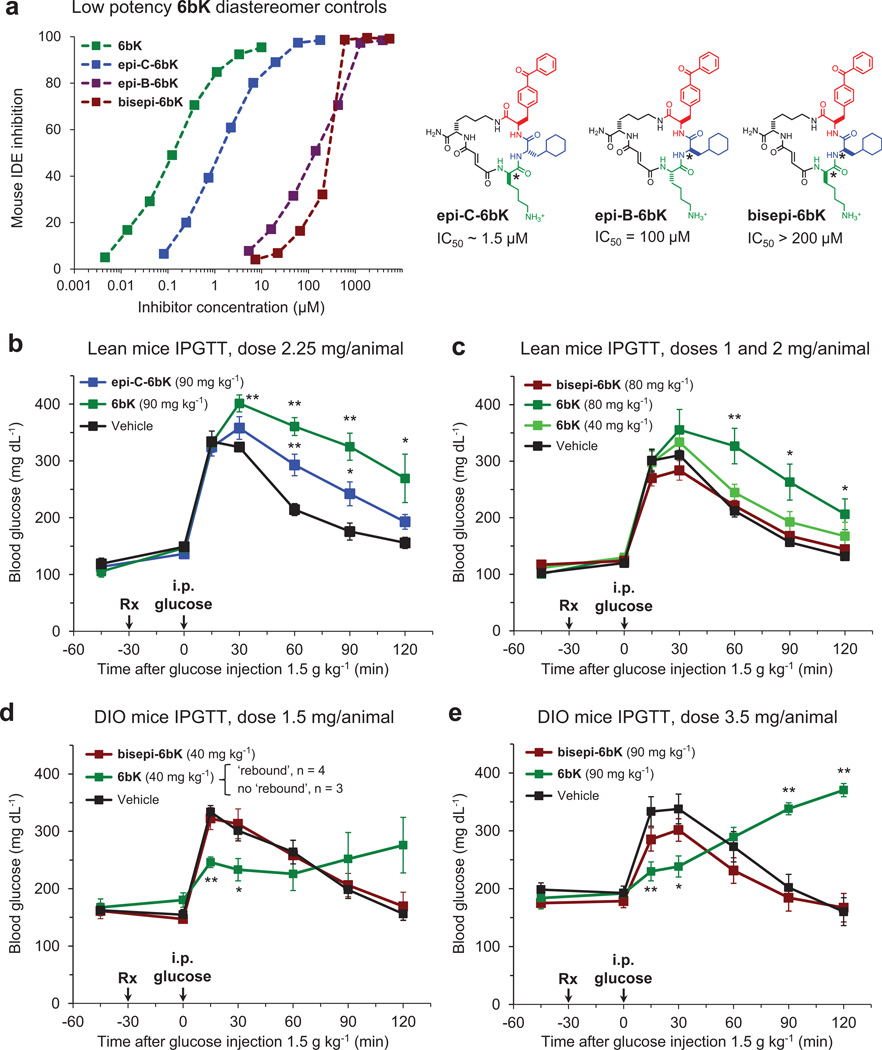
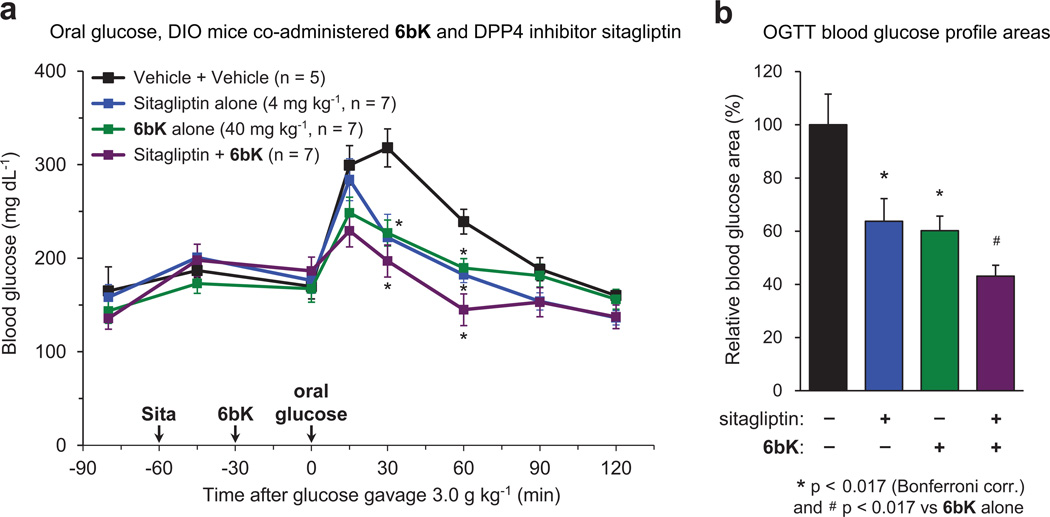
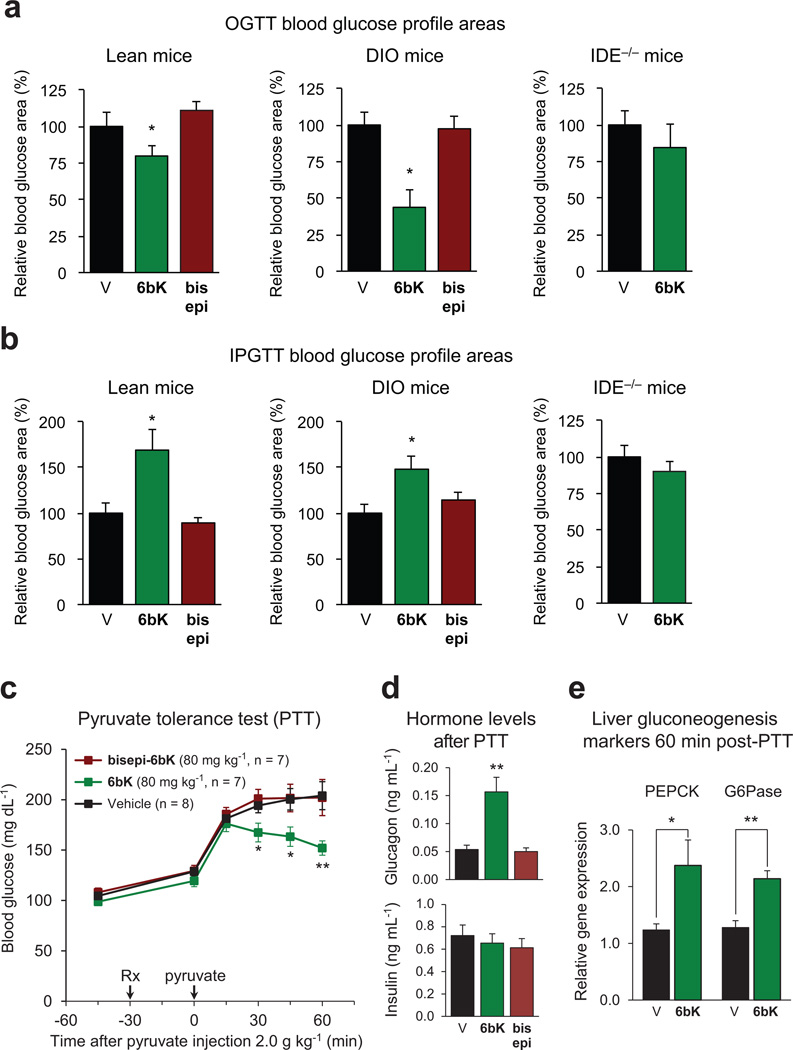
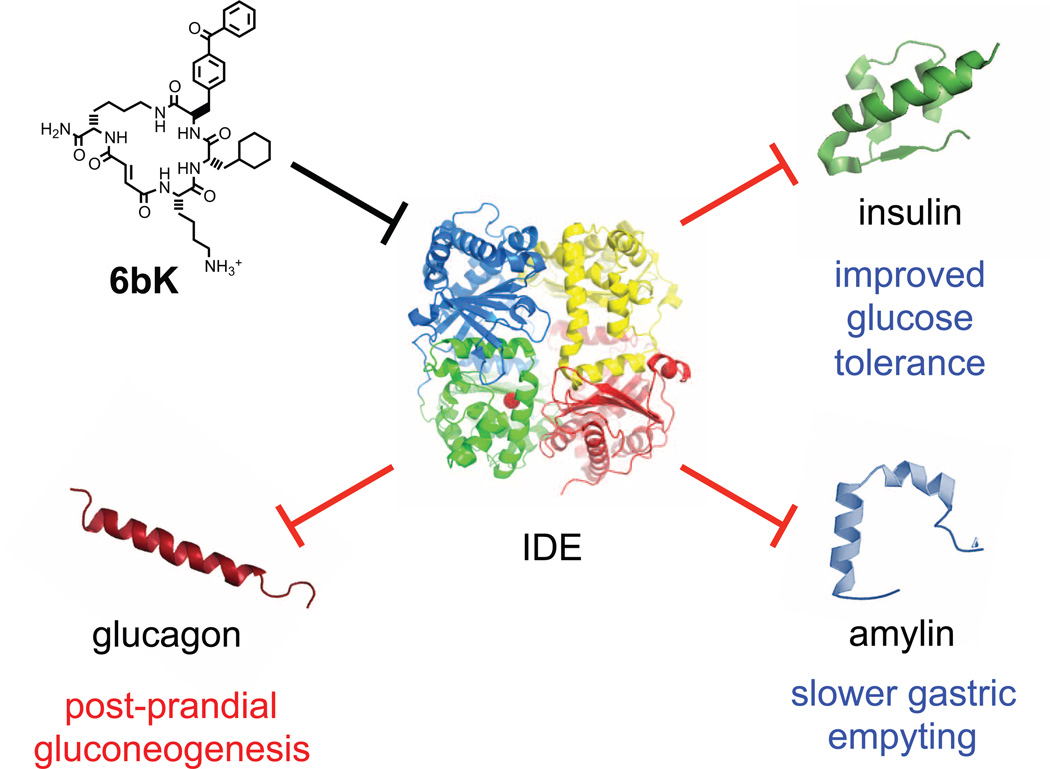
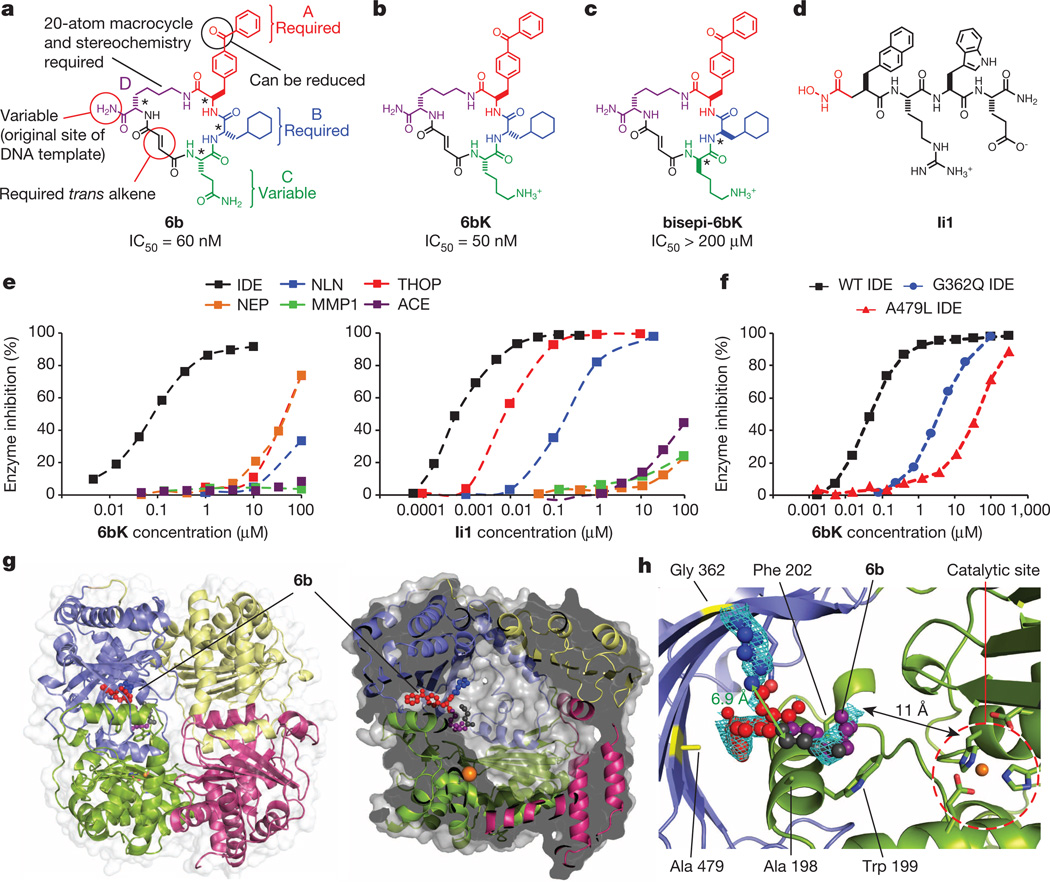
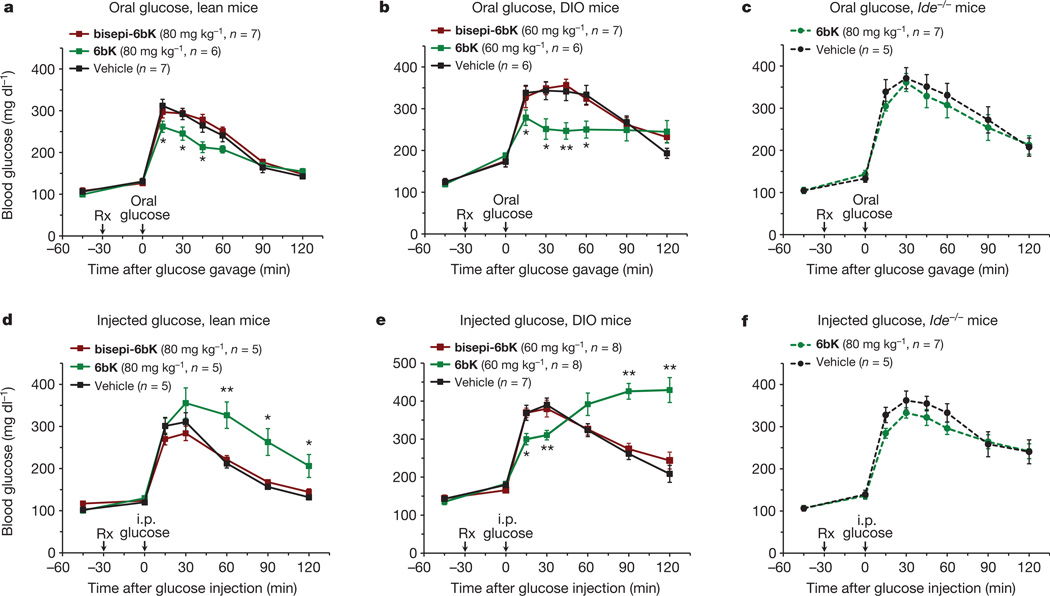
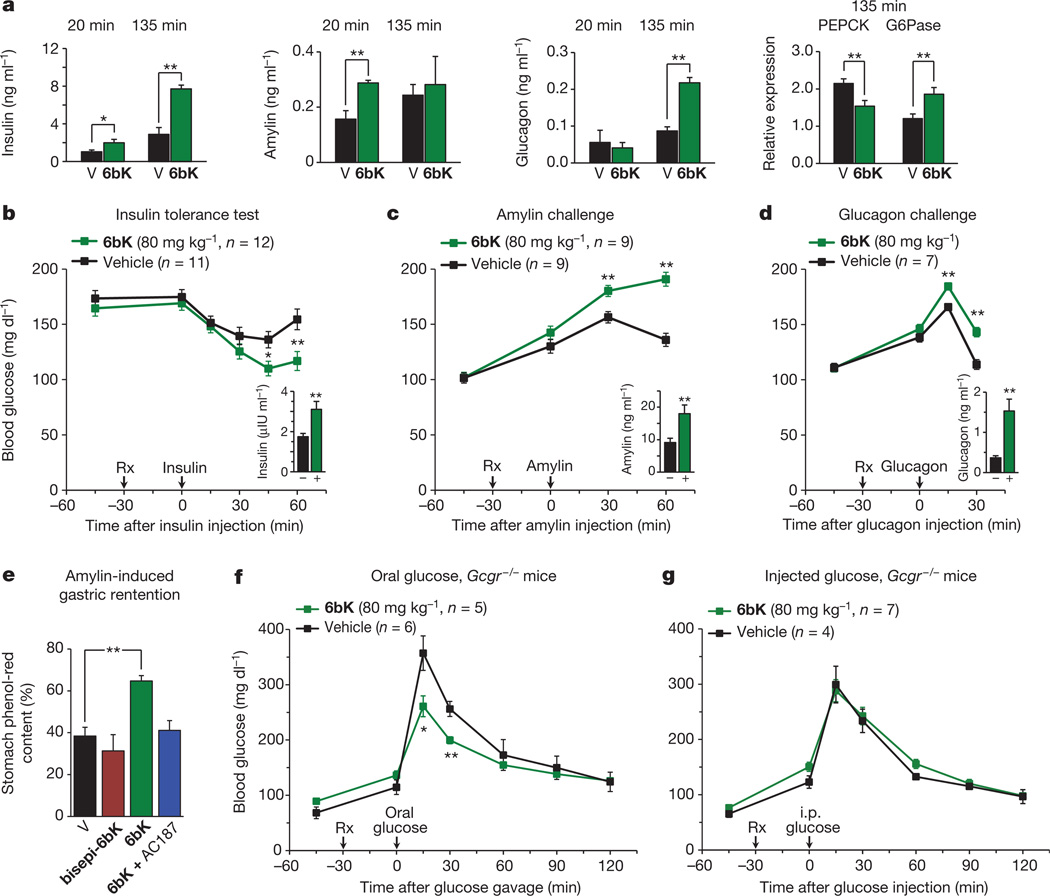
Despite decades of speculation that inhibiting endogenous insulin degradation might treat type-2 diabetes, and the identification of IDE (insulin-degrading enzyme) as a diabetes susceptibility gene, the relationship between the activity of the zinc metalloprotein IDE and glucose homeostasis remains unclear. Although Ide(-/-) mice have elevated insulin levels, they exhibit impaired, rather than improved, glucose tolerance that may arise from compensatory insulin signalling dysfunction. IDE inhibitors that are active in vivo are therefore needed to elucidate IDE's physiological roles and to determine its potential to serve as a target for the treatment of diabetes. Here we report the discovery of a physiologically active IDE inhibitor identified from a DNA-templated macrocycle library. An X-ray structure of the macrocycle bound to IDE reveals that it engages a binding pocket away from the catalytic site, which explains its remarkable selectivity. Treatment of lean and obese mice with this inhibitor shows that IDE regulates the abundance and signalling of glucagon and amylin, in addition to that of insulin. Under physiological conditions that augment insulin and amylin levels, such as oral glucose administration, acute IDE inhibition leads to substantially improved glucose tolerance and slower gastric emptying. These findings demonstrate the feasibility of modulating IDE activity as a new therapeutic strategy to treat type-2 diabetes and expand our understanding of the roles of IDE in glucose and hormone regulation.


Figures

Extended Data Figure 1
a, Enrichment plots from two independent in vitro selections against N-His6-mIDE using a 13,824-membered DNA-templated macrocycle library,. The numbers highlight compounds enriched at least twofold in both selections. b, Structures of IDE-binding macrocycles 1–6 decoded from DNA library barcodes corresponding to building blocks A, B, C and D (Fig. 1). The cis and trans isomers are indicated by suffices a and b respectively (for example, 1a and 1b). The two isomers were synthesized as previously reported, and separated by HPLC. c, IDE inhibition potency of trans hits 1b to 6b compared to 30 structurally related 6b analogues in which the linker, scaffold and the three building blocks were systematically varied. IDE inhibition activity was assayed by following cleavage of the fluorogenic peptide substrate Mca-RPPGFSAFK(Dnp)-OH.
Extended Data Figure 2
Extended Data Figure 2. Inhibition of human and mouse IDE activity in multiple assays
a, b, Human IDE shares 95% sequence homology with mouse IDE, and cleavage of the fluorogenic substrate peptide Mca-RPPGFSAFK(Dnp)-OH by human and mouse IDE is inhibited with similar potency by 6b (a) and 6bK (b). c, Homogeneous time-resolved fluorescence (HTRF) assay measuring degradation of insulin by IDE in the presence of 6b, 6bK and analogue 28 (Extended Data Fig. 1). d, LC-MS assay for ex vivo degradation of CGRP (10 µM) by endogenous IDE in mouse plasma in the presence of 6b. e, f, Biochemical assays suggesting that 6b binds a site in IDE distinct from the conventional peptide substrate binding site known to bind substrate mimetic Ii1. Yonetani–Theorell double inhibitor plots of IDE activity in the presence of 6b and Ii1 (panel e), or 6b and bacitracin (panel f). Crossing lines indicate synergistic and independent binding of inhibitors, while parallel lines indicate competition for binding to the enzyme.
Extended Data Figure 3
Extended Data Figure 3. Data collection and refinement statistics (molecular replacement), docking simulation for 6b, and competition test between insulin and fluorescein-labelled macrocycle 31 for binding cysteine-free IDE (CF-IDE)
a, One crystal was used to solve the CF-IDE•6b structure. The highest-resolution shell is shown in parentheses. Structure coordinates are deposited in the Protein Data Bank (accession number 4 LTE). b, Molecular docking simulations are consistent with the placement of building blocks A and B in the structural model (two views shown: top and bottom panels). The structure of 6b in the binding site from crystallographic data with composite omit map contoured at 1.0 σ (p-benzoyl-phenylalanine is shown in red, the cyclohexylalanine in blue, the fumarate linker in grey, and the d-lysine backbone in purple). c, Highest-scoring pose from DOCK simulations (glutamine group is shown in green, see Supplementary Information for docking calculations). d, Structure of macrocycle 6b and fluorescent analogue 31. Stars indicate atoms not resolved in the crystal structure (the Gln building block and four atoms of the flexible macrocycle backbone). e, Competition test between the fluorescein-labelled macrocycle 31 and insulin for binding CF-IDE. Cysteine-free catalytically inactive IDE was titrated against 0.9 nM macrocycle 31 alone (filled green circles) or together with 2.15 µM insulin (red filled circles), producing a shift in apparent dissociation constant for macrocycle 31 according to equation (1) (Supplementary Information). f, Residue-decomposed energy of the crystal (green) and docked (blue) poses of 6b (see Supplementary Information for docking calculations).
Extended Data Figure 4
Extended Data Figure 4. Small-molecule/enzyme mutant complementation study to confirm the macrocycle binding site and placement of the benzophenone and cyclohexyl building-block groups
a, IDE mutant A479L is inhibited by 6b > 600-fold less potently compared to wild-type IDE. b, Analogue 9, in which the p-benzoyl ring is substituted for a smaller t-butyl group, inhibits A479L IDE and WT IDE comparably. c, Similarly, IDE mutant G362Q is inhibited 77-fold less potently by 6b compared with WTIDE. d, Analogue 13, in which the L-cyclohexyl alanine side chain was substituted with a smaller L-leucine side chain, inhibits G362Q IDE and WT IDE comparably. The full list of IDE mutants investigated is shown in Supplementary Table 5. e, Synthetic scheme for 6bK, also used for synthesis of 6bK analogues.
Extended Data Figure 5
Extended Data Figure 5. Pharmacokinetic parameters of 6bK, augmented insulin hypoglycaemic action by 6bK in mice, and effects of 6bK on amyloid peptide levels
a, Plasma binding, plasma stability, and microsomal stability (1 h incubation) data (S. Johnston and C. Mosher, personal communication). b, Heavy-labelled 6bK was synthesized with 15N, 13C-lysine for stable-isotope dilution LC-MS quantitation. c, Behaviour and post-experiment body weight measurements were not affected for mice treated with 6bK (green; 80 mg kg−1) versus vehicle alone (black). The mice were active, and displayed normal posture, normal grooming and normal response to stimulation. d, Concentration of 6bK in mice tissues and plasma collected over 4 h determined by isotope dilution mass spectrometry (IDMS) with heavy-labelled analogue (n = 2 for all data except the last two time-points, for which n = 1). e, Average biodistribution of 6bK in five lean mice at 150 min post-injection of 6bK 80 mg kg−1 i.p. at the endpoint of an IPGTT experiment. We did not detect 6bK in the brain even using tenfold concentrated samples for LC-MS injection compared to other tissues. f, Treatment of C57BL/6J lean mice with 6bK (green, 80 mg kg−1, n = 6) does not change brain levels of Aβ(40) or Aβ(42) peptides in the brain 2 h post injection compared to treatment with vehicle alone (black, n = 5) or inactive diastereomer bisepi-6bK (brown, 80 mg kg−1, n = 6). g, Mice treated with a single injection of 6bK (green, 80 mg kg−1 i.p.) display increased hypoglycaemic response to insulin injection (Humulin-R, 1.0 U kg−1 i.p., see also Fig. 3b). Data shown in c–e and g are representative of two or more independent studies.
Extended Data Figure 6
Extended Data Figure 6. Dependence of insulin and glucagon secretion on the route of glucose administration (oral or i.p.) due to both the ‘incretin effect’ and the hyperinsulinaemic phenotype of DIO versus lean mice
a, The early insulin response to glucose in lean and DIO mice is higher during OGTT than IPGTT. b, Suppression of glucagon secretion post-glucose administration is less effective after IPGTT and in DIO mice. c, Administration of 6bK (green, 80 mg kg−1, n = 7) to lean mice not followed by injection of a nutrient such as glucose or pyruvate (see Figs 2–3) did not significantly alter basal blood glucose or basal hormone levels compared to bisepi-6bK (brown, n = 7) or vehicle controls (black, n = 7) 30 min post-injection. All data points and error bars represent mean ± s.e.m. Statistics were performed using a two-tail Student’s t-test, and significance levels shown in the figures are *P < 0.05 or **P < 0.01 between the labelled groups. Data shown are representative of two or more independent studies.
Extended Data Figure 7
Extended Data Figure 7. Low-potency diastereomers of 6bK used to determine effective dose range and confirm on-target IDE inhibition effects during IPGTTs
a, Left, inhibition of mouse IDE activity by low potency diastereomers of 6bK (right). The stereocentres altered in each compound relative to those of 6bK are labelled with asterisks. b–e, In dose optimization experiments, the effects of 6bK (40 to 90 mg kg−1, n = 5 and 4, respectively) were compared with equal doses of either weakly active stereoisomer epi-C-6bK (n = 5, panel b) or inactive stereoisomer bisepi-6bK (n = 5, panel c) and vehicle controls (n = 5) in IPGTTs using lean and obese mice. d, DIO mice treated with low doses of 6bK (40 mg kg−1, n = 7) responded to IPGTT in either of two ways: improved glucose tolerance throughout the experiment (n = 3) or a hyperglycaemic ‘rebound’ as described in the main text (n = 4), suggesting this dose is too low to achieve a consistent ‘rebound’ phenotype (note the large error bars). e, DIO mice treated with high doses of 6bK (3.5 mg per animal, 90 mg kg−1, n = 5) respond similarly to Fig. 2e (2 mg per animal, 60 mg kg−1), but the weak activity observed for bisepi-6bK (IC50 > 200 µM) using a matching dose (90 mg kg−1, n = 5) compared to vehicle alone (n = 5) suggests that 60 mg kg−1 (2 mg per animal) is the appropriate dose for DIO mice experiments. All data points and error bars represent mean ± s.e.m. Statistics were performed using a two-tail Student’s t-test, and significance levels shown in the figures are *P < 0.05 versus vehicle control group; **P < 0.01 versus vehicle control group. Data shown in b–e are representative of two or more independent studies.
Extended Data Figure 8
Extended Data Figure 8. Effects of co-administration of 6bK and dipeptidyl peptidase 4 (DPP4) inhibitor sitagliptin followed by oral glucose challenge
a, DIO mice were first treated with either oral gavage of sitagliptin (4 mg kg−1, 5 ml kg−1 in sterile saline, n = 14) or saline alone (n = 12). After 30 min, each group of mice were treated either with a low dose of 6bK (40 mg kg−1, n = 7) or vehicle alone (n = 5), and after an additional 30 min all mice were given a bolus of glucose by gavage (3.0 g kg−1, 10 ml kg−1). Mice treated with the combination of sitagliptin and 6bK displayed glucose levels lower than baseline (t = 0) after 60 min. b, Blood glucose profile areas of sitagliptin and 6bk were similarly reduced by 60–64% compared to vehicle alone, and further 15% lower when sitagliptin and 6bK were co-administered. Symbol and bar colour-coding: black, vehicle alone; blue, sitagliptin alone; green, 6bK alone; purple, sitagliptin + 6bK. All data points and error bars represent mean ± s.e.m. Statistics were performed using a one-tail Student’s t-test. Significance levels shown in the figures are: *P < 0.017 (Bonferroni correction) versus vehicle control group, #P < 0.017 versus the 6bK cohort. See Supplementary Methods for a description of the AUC calculation. The data shown are from a study performed once.
Extended Data Figure 9
Extended Data Figure 9. Glucose tolerance test AUC(area under the curve) calculations, and pyruvate tolerance test for gluconeogenesis during IDE inhibition
a, AUC calculations for Fig. 2 data show that during OGTT, lean and DIO mice treated with 6bK display improved glucose tolerance, compared to vehicle controls and inactive bisepi-6bK. b, In contrast, during IPGTT both lean and DIO mice treated with 6bK display impaired glucose tolerance compared to vehicle or bisepi-6bK controls. The AUCs for 6bK versus vehicle treatments using Ide−/− mice are similar for both OGTT and IPGTT. c, Wild-type mice fasted overnight were injected i.p. with pyruvate (2.0 g kg−1) 30 min after treatment with 6bK, inactive analogue bisepi-6bK, or vehicle alone. d, Plasma hormone measurements 60 min post-PTT reveal elevated glucagon (top) but similar insulin (bottom) levels for the 6bK-treated cohort relative to bisepi-6bK or vehicle controls. e, RT–PCR analysis of liver samples 60-min post-PTT revealed elevated gluconeogenesis transcriptional markers for the 6bK-treated group relative to vehicle controls. All data points and error bars represent mean ± s.e.m. Statistics were performed using a two-tail Student’s t-test, and significance levels shown in the figures are *P < 0.05 versus vehicle control group; **P < 0.01 versus vehicle control group. See Supplementary Methods for a description of the AUC calculation. Data shown not involving knockout mice are representative of two or more independent studies; studies on knockout mice and PTT measurements were performed once.
Extended Data Figure 10
Extended Data Figure 10. Model for the expanded roles of IDE in glucose homeostasis and gastric emptying based on the results of this study
IDE inhibition increases the abundance and signalling of three key pancreatic peptidic hormones—insulin, amylin and glucagon—with the corresponding physiological effects shown in blue, blue and red, respectively.
Figure 1
Figure 1. Potent and highly selective macrocyclic IDE inhibitors from the in vitro selection of a DNA-templated macrocycle library
a, Structure of 6b and summary of the requirements for IDE inhibition revealed by assaying 6b analogues (Extended Data Fig. 1). b, Physiologically active IDE inhibitor 6bK. c, Inactive diastereomer bisepi-6bK. d, Previously reported substrate-mimetic hydroxamic acid Ii110. e, Selectivity analysis of macrocycle 6bK reveals >1,000-fold selectivity for IDE (IC50 = 50 nM) over all other metalloproteases tested. In contrast, inhibitor Ii110 inhibits IDE (IC50 = 0.6 nM), thimet oligopeptidase (THOP, IC50 = 6 nM) and neurolysin (NLN, IC50 = 185 nM), but not NEP (neprilysin), MMP1 (matrix metalloproteinase, 1) or ACE (angiotensin-converting enzyme). f, Activity assays for wild-type or mutant human IDE variants in the presence of 6bK. g, X-ray co-crystal structure of IDE bound to macrocyclic inhibitor 6b (2.7 Å resolution, PDB 4LTE). h, Electron density map (composite omit map contoured at 1σ) showing the relative position of macrocycle 6b bound 11 Å from the catalytic zinc atom. The glutamine residue and four atoms of the macrocycle backbone were unresolved. See also Extended Data Figs 2–4.
Figure 2
Figure 2. Physiological consequences of acute IDE inhibition by 6bK on glucose tolerance in lean, DIO and Ide−/− mice
a, b, Oral glucose tolerance during acute IDE inhibition. a, Male C57BL/6J lean (25 g) mice were treated (at time Rx) with a single i.p. injection of IDE inhibitor 6bK, inactive control bisepi-6bK, or vehicle alone, 30 min before glucose gavage (3.0 g kg−1). b, DIO mice (35–45 g) were treated with 6bK, and inactive control bisepi-6bK or vehicle alone 30 min before glucose gavage (3.0 g kg−1). c, Mice lacking the target (Ide−/−) treated with 6bK followed by oral glucose (3.0 g kg−1) produce a response comparable to that of vehicle-treated Ide−/− mice. d, e, Glucose tolerance phenotypes after i.p. injection of glucose (1.5 g kg−1) in, respectively, lean (d) and DIO (e) male mice treated with 6bK, inactive bisepi-6bK, or vehicle alone. f, Mice lacking IDE treated with 6bK followed by IPGTT (1.5 g kg−1) produce a response comparable to that of vehicle-treated Ide−/− mice. Area under the curve (AUC) calculations are shown in Extended Data Fig. 9. Data: mean ± s.e.m.; *P < 0.05, **P < 0.01 in two-tail Student’s t-test. Data shown in a, b, d and e are representative of two or more independent studies. Control studies using knockout mice were performed once.
Figure 3
Figure 3. Acute IDE inhibition affects the abundance of multiple hormone substrates and their corresponding effects on blood glucose levels
a, Plasma hormone measurements at 20 min and 135 min after i.p.-injected glucose tolerance tests (IPGTTs) on DIO mice (Fig. 2e) and RT–PCR analysis of DIO liver samples collected at 135 min after IPGTT. RT–PCR reveals 50% higher glucose-6-phosphatease (G6Pase) and 30% lower phosphoenolpyruvate carboxykinase (PEPCK) transcript levels for the 6bK-treated cohort (6bK; n = 7) versus vehicle-only controls (V; n = 7). b–d, Blood glucose responses and injected hormone abundances in lean mice 30 min after treatment with 6bK or vehicle alone. b, Insulin (0.25 U kg−1, subcutaneous) after 5-h fast. c, Amylin (250 µg kg−1, subcutaneous) after overnight fast. d, Glucagon (100 µg kg−1, subcutaneous) after overnight fast. Trunk blood was collected at the last time-points for plasma hormone measurements (insets; IU, international units). e, Acute IDE inhibition slows gastric emptying through amylin signalling. Fasted WT mice were given oral glucose supplemented with 0.1 mg ml−1 phenol red 30 min after treatment with 6bK alone (n = 6), 6bK co-administered with the amylin receptor antagonist AC187 (3 mg kg−1 i.p., n = 6), vehicle alone (V; n = 6) or inactive bisepi-6bK (n = 4). f, g, G-protein-coupled glucagon receptor knockout mice (Gcgr−/−) treated with IDE inhibitor 6bK display altered glucose tolerance relative to vehicle-treated mice if challenged with oral glucose (3.0 g kg−1; f) but not i.p. injected glucose (1.5 g kg−1; g). Data: mean ± s.e.m.; *P < 0.05, **P < 0.01 in two-tail Student’s t-test. Data shown in ae are representative of two or more independent studies. Studies using Gcgr−/− knockout mice were performed once.

Comment in

References

    1. Duckworth WC, Bennett RG, Hamel FG. Insulin degradation: progress and potential. Endocr. Rev. 1998;19:608–624. - PubMed
    1. Mirsky IA, Broh-Kahn RH. The inactivation of insulin by tissue extracts the distribution and properties of insulin inactivating extracts. Arch. Biochem. 1949;20:1–9. - PubMed
    1. Sladek R, et al. A genome-wide association study identifies novel risk loci for type 2 diabetes. Nature. 2007;445:881–885. - PubMed
    1. Zeggini E, et al. Replication of genome-wide association signals in UK samples reveals risk loci for type 2 diabetes. Science. 2007;316:1336–1341. - PMC - PubMed
    1. Farris W, et al. Insulin-degrading enzyme regulates the levels of insulin, amyloid beta-protein, and the beta-amyloid precursor protein intracellular domain in vivo. Proc. Natl Acad. Sci. USA. 2003;100:4162–4167. - PMC - PubMed

Publication types

MeSH terms

Associated data