. 2014 Sep;128(3):381-96.
doi: 10.1007/s00401-014-1295-x. Epub 2014 May 22.

Brain pericytes acquire a microglial phenotype after stroke

Affiliations

Brain pericytes acquire a microglial phenotype after stroke

Ilknur Özen et al. Acta Neuropathol. 2014 Sep.

Abstract

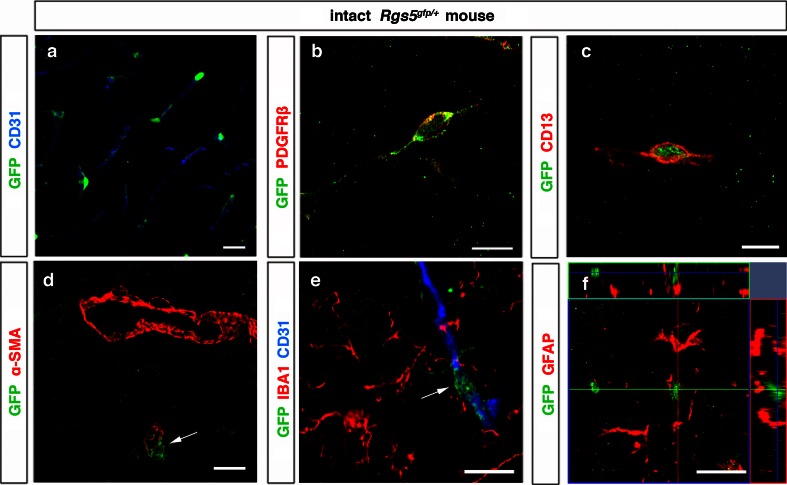
Pericytes are located on the abluminal side of endothelial cells lining the microvasculature in all organs. They have been identified as multipotent progenitor cells in several tissues of the body including the human brain. New evidence suggests that pericytes contribute to tissue repair, but their role in the injured brain is largely unknown. Here, we investigate the role of pericytes in ischemic stroke. Using a pericyte-reporter mouse model, we provide unique evidence that regulator of G-protein signaling 5 expressing cells are activated pericytes that leave the blood vessel wall, proliferate and give rise to microglial cells after ischemic brain injury. Consistently, we show that activated pericytes express microglial markers in human stroke brain tissue. We demonstrate that human brain-derived pericytes adopt a microglial phenotype and upregulate mRNA specific for activated microglial cells under hypoxic conditions in vitro. Our study indicates that the vasculature is a novel source of inflammatory cells with a microglial phenotype in brain ischemia and hence identifies pericytes as an important new target for the development of future stroke therapies.


Figures

Fig. 1
Fig. 1
RGS5-expressing cells in the intact mouse cortex. a Confocal images showing cortical brain section derived from intact Rgs5 gfp/+ mice with blood vessel (CD31, blue) surrounded by GFP+ pericytes, scale bar 20 μm. GFP+ pericytes express PDGFRβ (red) (b), CD13 (red) (c), but not α-SMA (red, arrow) (d), scale bar 10 μm. GFP+ pericytes do not double-label with the microglia marker IBA1 (red, arrow) (e), and the astrocyte marker GFAP (red) (f), scale bar 10 μm
Fig. 2
Fig. 2
Pericytes proliferate in response to experimental stroke. a The illustration shows the experimental design for permanent middle cerebral artery occlusion (pMCAO) (left). Schematic representation of a coronal brain section showing the location of the cortical infarct core, peri-infarct area, and contralateral hemisphere (right). b, c GFP+ pericytes increase in the infarct area over time with a maximum at 7 days, scale bar 100 μm (n = 5, mean ± SD, ***p < 0.0001, ANOVA). d GFP+ pericytes express both BrdU (blue) and Ki67 (red) in the infarct area at 7 days after stroke, scale bar 10 μm. e GFP+ pericytes do not label with BrdU or Ki67 in the contralateral hemisphere (arrowhead), scale bar 10 μm. pMCAO permanent middle cerebral artery occlusion, ic infarct core, pi peri-infarct area, contra contralateral hemisphere
Fig. 3
Fig. 3
Pericytes are activated and leave the capillary wall after experimental stroke. a Confocal images showing GFP+ pericyte around blood vessel (CD31, blue) in the quiescent state in the contralateral hemisphere, scale bar 5 µm. b An activated pericyte (green) with prominent soma along the capillary (CD31, blue) expressing NG2 (red) in the infarct area, 1 day after stroke, scale bar 5 μm. c All GFP+ pericytes express NG2 (red) in the infarct area at 1 day, scale bar 20 μm. d Projection of a confocal stack showing a GFP+ pericyte (arrow) that leaves the blood vessel (CD31, blue) in the infarct core, 7 days after injury, scale bar 10 μm
Fig. 4
Fig. 4
Pericytes express microglia markers GAL-3 and IBA1 after experimental stroke. Seven days after the ischemic injury, GFP+ cells in the parenchyma co-express GAL-3 (red, arrows), whereas GFP+ pericytes located around the blood vessels (laminin, blue) are negative for GAL-3 (red, asterisk) in a the infarct core and b the peri-infarct area, scale bar 20 μm. c GFP+ cells co-labeling with IBA1 (red, arrow) and GFP+ pericytes around a blood vessel (CD31, blue) negative for IBA1 (asterisk) in the peri-infarct area, scale bar 10 μm. (d) GFP+ cells, with characteristics of either ameboid (arrows) or ramified microglia (framed cell) in the parenchyma, co-expressing both GAL-3 (blue) and IBA1 (red), and activated GFP+ pericytes negative for GAL-3 and IBA1 (asterisk) in the peri-infarct area, 7 days after ischemic injury, scale bar 20 μm. Right panels show high-magnification confocal images of a ramified GFP+ cell co-expressing GAL-3 (blue) and IBA1 (red, framed cell), scale bar 10 μm. High magnification of GAL-3-expressing (red) GFP+ cell in the peri-infarct area 7 days (e) and 21 days (f) after the injury, scale bar 10 μm
Fig. 5
Fig. 5
Pericytes express microglia marker CD11b after stroke. a GFP+ cells co-localized with both IBA1 (blue) and CD11b (red, arrows) in the peri-infarct area, 7 days after injury, scale bar 20 μm. High-magnification confocal image of CD11b-expressing (red) GFP+ cells in the parenchyma (b, c) and around the blood vessel (d) in the peri-infarct area, 7 days after injury, scale bars 10 μm. Quiescent GFP+ pericytes around the blood vessel (CD31, blue) do not label with microglia markers IBA1 (red) (e) and CD11b (red) (f) in the contralateral side of the ischemic brain, scale bar 10 μm. g Microglia cells derived from Rgs5 gfp/+mice were positively sorted for the microglia marker CD11b. h There was no upregulation of Rgs5 mRNA levels in OGD-stimulated microglia derived from Rgs5 gfp/+mice. Rgs5 gfp/+mouse brain served as a positive control (p = 0.2292, two-tailed t test). OGD oxygen–glucose deprivation, CTRL control, NS not significant
Fig. 6
Fig. 6
Pericytes are negative for the macrophage/microglial marker CD68 and the leukocyte marker CD45. a A confocal image showing that CD68+ cells (red) are closely associated with blood vessels (CD31, blue), but do not co-label with GFP+ pericytes in the infarct core 1 day after stroke, scale bar 20 μm. b Seven days after stroke, CD68+/CD11b+ cells are seen but do not co-localize with GFP+ cells, scale bar 10 μm. c A confocal image showing that CD45+ cells (red) are found closely associated with blood vessels (CD31, blue), but do not co-label with GFP+ pericytes in the infarct core 1 day after stroke, scale bar 10 μm. d, e Seven days after stroke, CD45+/CD11b+ cells do not co-localize with GFP+ cells, scale bars 20 μm
Fig. 7
Fig. 7
Pericytes are not activated in the bone marrow after stroke. af Confocal images showing low frequency of GFP+ cells found in the bone marrow (arrows). GFP+ cells do not co-localize with CD45 (red) in the bone marrow of intact Rgs5 gfp/+mice (a), at 1 day (b) and 7 days (c) after stroke, scale bar 20 μm. GFP+ cells do not co-localize with CD11b (red) in the bone marrow of intact Rgs5 gfp/+mice (d), at 1 day (e) and 7 days (f) after stroke, scale bar 20 μm. TOTO-3 Iodide (blue) was used as a nuclear counterstain. g Flow cytometry analysis shows that bone marrow cells isolated from Rgs5 gfp/+ mice 1 and 7 days after stroke are negative for GFP, but are positive for CD45 and Ter119 and CD11b. BM bone marrow
Fig. 8
Fig. 8
RGS5+ pericytes are distinct from scar-forming cells. a PDGFRβ expression increased around the infarct core 7 days after stroke, scale bar 200 μm. a′ High magnification of PDGFRβ+ cells with irregular thin processes (framed area in a), scale bar 20 μm. b α-SMA expression around the infarct core 7 days after ischemic injury, scale bar 200 μm. b′ Similar to PDGFRβ staining, α-SMA+ cells have irregular thin processes (framed area in b), scale bar 20 μm. c GFP+ cells express PDGFRβ (red) 1 day after injury, scale bar 10 μm. d GFP+ cells that have left the capillary wall are negative for PDGFRβ (red) in the infarct core (dotted area) 7 days after the injury, scale bar 10 μm. d′ PDGFRβ-expressing cells (red) do not co-localize with GFP+ cells (arrowheads) (framed area in d), scale bar 10 μm. GFP+ cells do not express e α-SMA (red) and fibrous extracellular matrix proteins including f fibronectin (red), g collagen-IV (red) or h fibroblast-specific protein (red) in the infarct core 7 days after the injury, scale bars 20 μm. FN fibronectin, col-IV collagen-IV, FSP fibroblast-specific protein
Fig. 9
Fig. 9
Human brain pericytes acquire a microglial phenotype. Confocal image showing, a neocortical brain section with a capillary lined with pericytes doubled labeled for RGS5 (green) and PDGFRβ (red), scale bar 10 μm, b RGS5+ activated pericyte (green) expressing PDGFRβ (red, framed) with prominent soma in the peri-infarct area of stroke human brain, scale bar 5 μm. c RGS5+ cells (green) co-express GAL-3 (red, framed area) around the blood vessels (DAPI, blue, lower panel) in the peri-infarct area of stroke human brain, scale bar 50 μm. d Representative histograms of flow cytometry analysis of human brain-derived pericyte line. Cells express both CD140b/PDGFRβ and CD13 (99.1 %), but no markers for microglia/macrophages (CD45 and CD11b) (0.166 %) or monocytes (CD14 and CD11b) (0.052 %). e Bright field image showing human brain-derived pericytes under control conditions, scale bar 20 μm. Human brain-derived pericytes express, f, g PDGFRβ (red) and α-SMA (green). h Morphological changes in the proliferating pericytes after 2 h OGD, scale bar 20 μm. Human brain-derived pericytes express, i GAL-3 and j CD11b after exposure to OGD, scale bar 20 μm. k Graphs showing upregulation of mRNA levels of microglia markers in human brain-derived pericytes stimulated with OGD compared to unstimulated controls; CD11B (**p < 0.004), IBA1 (**p < 0.005), GAL3 (***p < 0.0001), TNFA (**p < 0.001), and MHC11 (***p < 0.0001). At the same time, mRNA expression for pericyte markers decreased significantly in stimulated pericytes compared to unstimulated controls; PDGFRB (**p < 0.0034), CD13 (***p < 0.0001) and ASMA (****p < 0.0001), two-tailed t test. OGD oxygen–glucose deprivation

References

    1. Alliot F, Godin I, Pessac B. Microglia derive from progenitors, originating from the yolk sac, and which proliferate in the brain. Brain Res Dev Brain Res. 1999;117(2):145–152. - PubMed
    1. Arimura K, Ago T, Kamouchi M, Nakamura K, Ishitsuka K, Kuroda J, Sugimori H, Ooboshi H, Sasaki T, Kitazono T. PDGF receptor beta signaling in pericytes following ischemic brain injury. Curr Neurovasc Res. 2012;9(1):1–9. - PubMed
    1. Armulik A, Genove G, Mae M, Nisancioglu MH, Wallgard E, Niaudet C, He L, Norlin J, Lindblom P, Strittmatter K, Johansson BR, Betsholtz C. Pericytes regulate the blood-brain barrier. Nature. 2010;468(7323):557–561. - PubMed
    1. Audoy-Remus J, Richard JF, Soulet D, Zhou H, Kubes P, Vallieres L. Rod-shaped monocytes patrol the brain vasculature and give rise to perivascular macrophages under the influence of proinflammatory cytokines and angiopoietin-2. J Neurosci. 2008;28(41):10187–10199. - PMC - PubMed
    1. Balabanov R, Washington R, Wagnerova J, Dore-Duffy P. CNS microvascular pericytes express macrophage-like function, cell surface integrin alpha M, and macrophage marker ED-2. Microvasc Res. 1996;52(2):127–142. - PubMed

Publication types

MeSH terms

LinkOut - more resources