. 2014 May 21;9(5):e97683.
doi: 10.1371/journal.pone.0097683. eCollection 2014.

Extending the Schizosaccharomyces pombe molecular genetic toolbox

Affiliations

Extending the Schizosaccharomyces pombe molecular genetic toolbox

Dorota Fennessy et al. PLoS One. .

Abstract

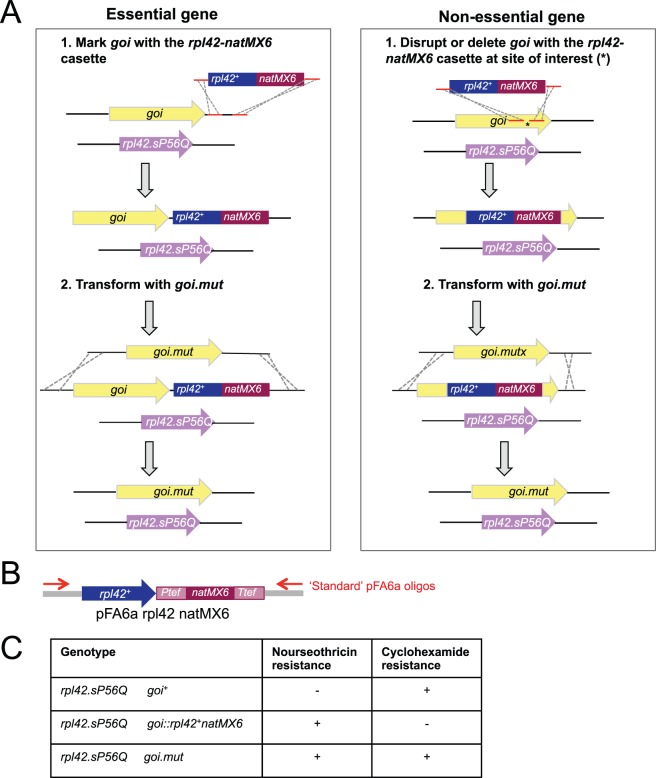
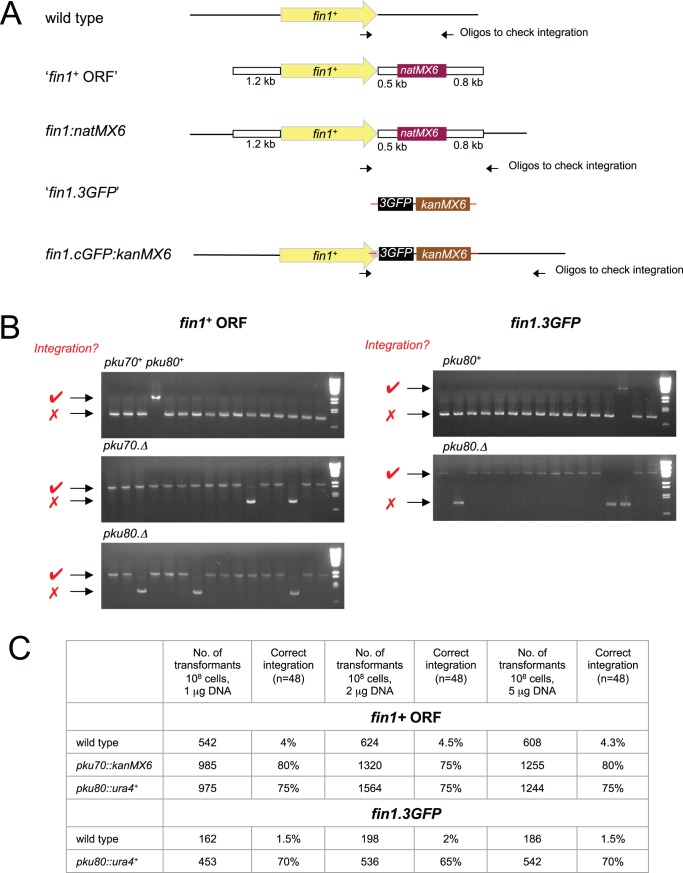
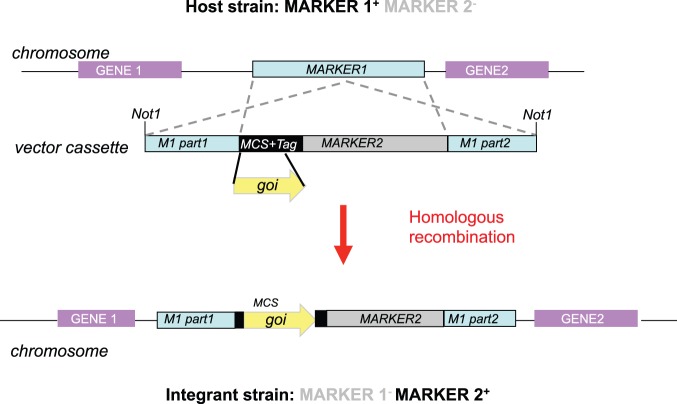
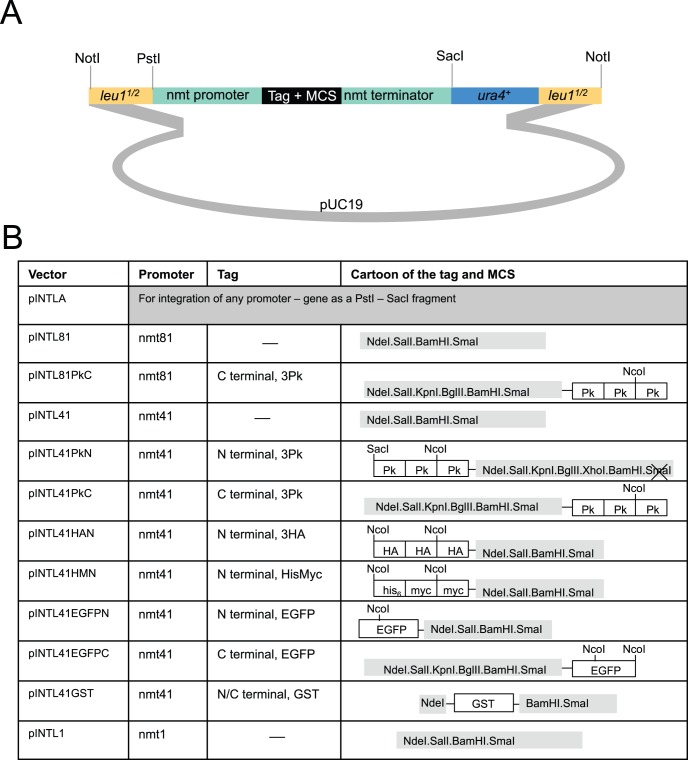
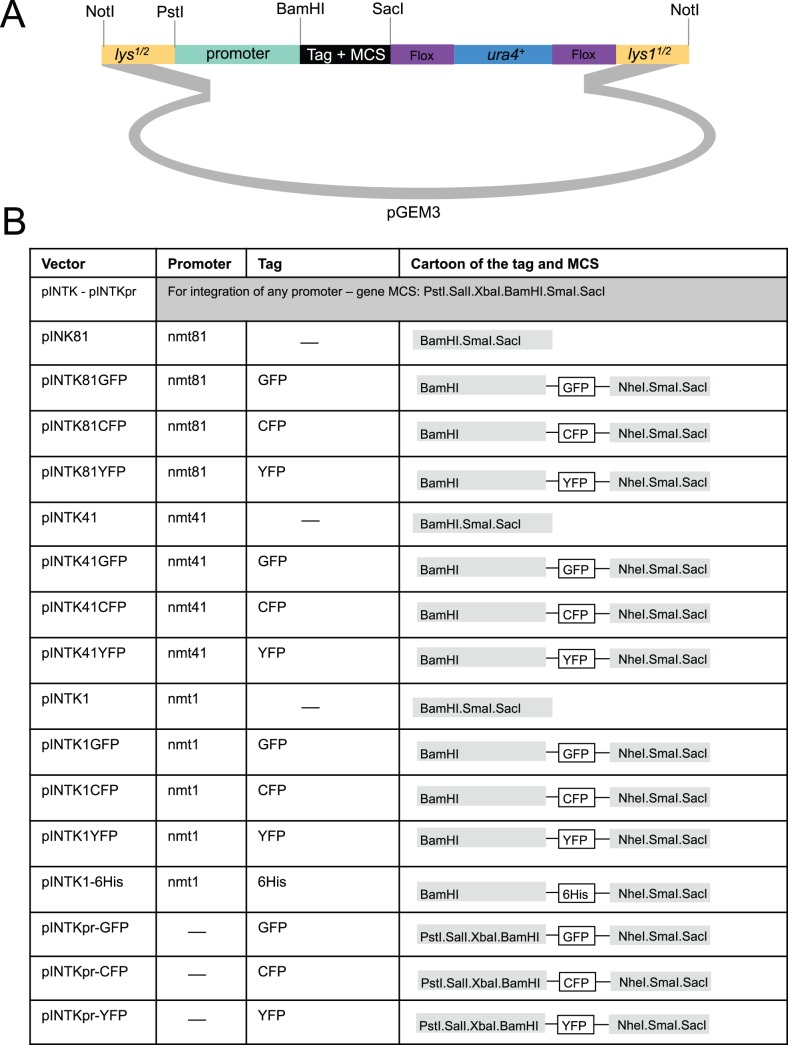
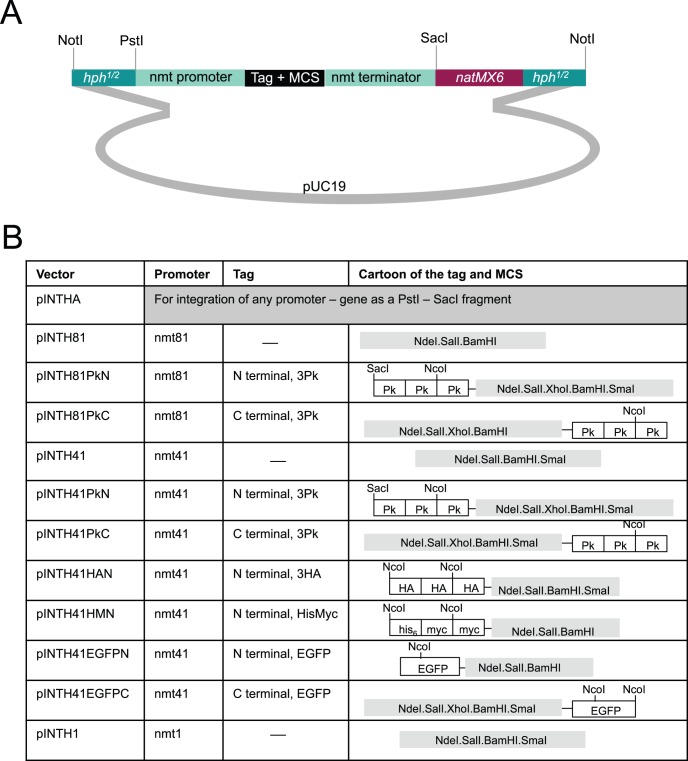
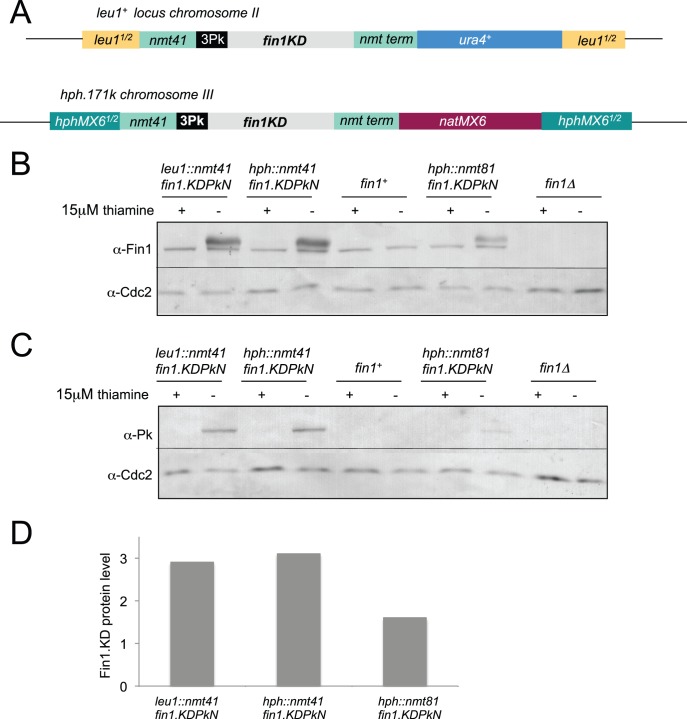
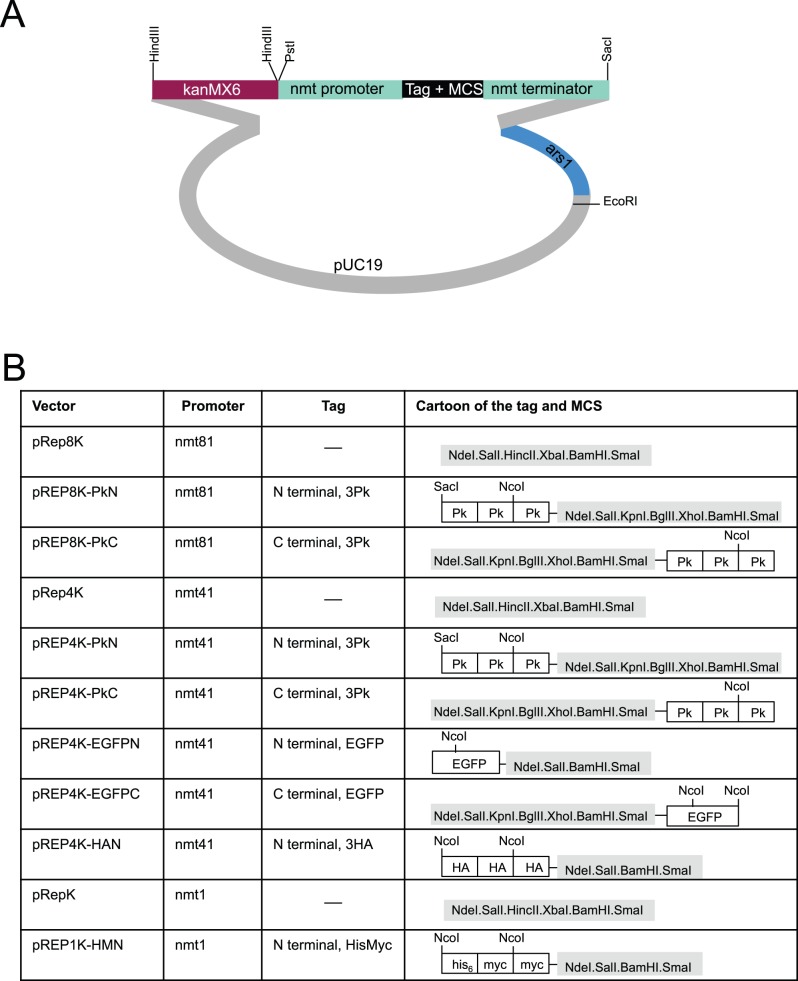
Targeted alteration of the genome lies at the heart of the exploitation of S. pombe as a model system. The rate of analysis is often determined by the efficiency with which a target locus can be manipulated. For most loci this is not a problem, however for some loci, such as fin1+, rates of gene targeting below 5% can limit the scope and scale of manipulations that are feasible within a reasonable time frame. We now describe a simple modification of transformation procedure for directing integration of genomic sequences that leads to a 5-fold increase in the transformation efficiency when antibiotic based dominant selection markers are used. We also show that removal of the pku70+ and pku80+ genes, which encode DNA end binding proteins required for the non-homologous end joining DNA repair pathway, increases the efficiency of gene targeting at fin1+ to around 75-80% (a 16-fold increase). We describe how a natMX6/rpl42+ cassette can be used for positive and negative selection for integration at a targeted locus. To facilitate the evaluation of the impact of a series of mutations on the function of a gene of interest we have generated three vector series that rely upon different selectable markers to direct the expression of tagged/untagged molecules from distinct genomic integration sites. pINTL and pINTK vectors use ura4+ selection to direct disruptive integration of leu1+ and lys1+ respectively, while pINTH vectors exploit nourseothricin resistance to detect the targeted disruption of a hygromycin B resistance conferring hphMX6 cassette that has been integrated on chromosome III. Finally, we have generated a series of multi-copy expression vectors that use resistance to nourseothricin or kanamycin/G418 to select for propagation in prototrophic hosts. Collectively these protocol modifications and vectors extend the versatility of this key model system.


Conflict of interest statement

Competing Interests: The authors have declared that no competing interests exist.

Figures

Figure 1
Figure 1. Manipulating native loci with an rpl42+/natMX6 cassette.
A) Approaches used for targeted mutagenesis. B) The structure of the pFA6arpl42natMX6 plasmid. C) The phenotype switches arising from the progression through the indicated genotypes.
Figure 2
Figure 2. Inclusion of pku70.Δ and pku80.Δ in host strain radically enhances targeting at the fin1 + locus.
A) Cartoons depicting the structure of the DNA fragments used to direct the integration of a natMX6 cassette 3′ to the Fin1 coding sequences at the fin1 + locus and the integration of sequences encoding three GFP molecules, a stop codon and the kanRMX6 marker at the end of the fin1 + locus. B) PCR amplification reactions with the oligonucleotides indicated by arrows in panel A to monitor the structure of the genomic regions at the fin1 + locus. For the “fin1 ORF” transformation amplification gives an 850 bp fragment (red cross next to each panel), whereas with successful integration generates an 2050 bp fragment (red tick next to each panel). For the “fin1.3GFP” transformation amplification with the same primers used to screen “ fin1 ORF” transformants generated an 850 bp fragment in the recipient host (red cross next to each panel) and an 4650 bp fragment in the correct transformant (red tick next to each panel). C) A table showing the frequency of correct integration events in the indicated strains with the indicated concentrations of each DNA fragment as determined by PCR analysis of 48 candidate transformants in each case.
Figure 3
Figure 3. A cartoon indicating the approach used by all three integration vector systems.
Figure 4
Figure 4. The pINTL series of vectors for the expression of a gene of interest from the leu1 locus.
Cartoons depicting the structure of the indicated pINTL vectors.
Figure 5
Figure 5. The pINTK series of vectors for the expression of a gene of interest from the lys1 locus.
Cartoons depicting the structure of the indicated pINTK vectors.
Figure 6
Figure 6. The pINTH series of vectors for the expression of a gene of interest from the hph.171k locus on chromosome III.
Cartoons depicting the structure of the indicated pINTH vectors.
Figure 7
Figure 7. Integration at either the hph.171k or leu1 loci gave identical levels of protein expression.
A) Cartoons showing the structure of the two nmt41 integrated cassettes from which catalytically inactive Fin1.KD fusion proteins (three “Pk” SV5 epitopes fused, in frame, to their amino termini) are expressed upon removal of thiamine. B) Cells were grown to early log phase in EMM2+15 µM thiamine at 25°C before being washed three times in thiamine free EMM2 medium and re-suspended in EMM2 at a density of 1.8×10⁵. Protein extracts were prepared from the mid-log phase cultures and processed for Western Blots after a further 15 hours culture at 25°C. Blots were cut in two; high molecular weight regions were probed with Fin1 antibodies while the loading control, While Cdc2 was detected on the lower molecular weight portion of the same blot. C) The same samples as shown in B probed with Cdc2 and mAb336 antibodies that recognised the Pk tags on the Fin1.KD3Pk fusion protein. D) A plot of the intensity ratios between the Fin1 and Cdc2 bands in each lane of the blots in B setting the ratio seen in wild type cells as 1 and that detected in fin1.Δ control as 0.
Figure 8
Figure 8. The pREPN series of vectors for the expression of a gene of interest from an ectopic plasmid.
Cartoons depicting the structure of the indicated pREPN vectors.
Figure 9
Figure 9. The pREPK series of vectors for the expression of a gene of interest from an ectopic plasmid.
Cartoons depicting the structure of the indicated pREPK vectors.

References

    1. Gutz H, Heslot H, Leupold U, Loprieno N (1974) Schizosaccharomyces pombe. In: King RC, editor. Handbook of Genetics. New York: Plenum press. 395–445.
    1. Moreno S, Klar A, Nurse P (1991) Molecular genetic analysis of fission yeast Schizosaccharomyces pombe . Methods In Enzymology 194: 795–823. - PubMed
    1. Forsburg SL, Rhind N (2006) Basic methods for fission yeast. Yeast 23: 173–183. - PMC - PubMed
    1. Reaume SE, Tatum EL (1949) Spontaneous and nitrogen mustard-induced nutritional deficiencies in Saccharomyces cerevisiae . Arch Biochem 22: 331–338. - PubMed
    1. Leupold U (1970) Genetical methods for Schizosaccharomyces pombe. In: Prescott D, editor. Methods in cell physiology. New York: Academic Press. 169–177.

Publication types

MeSH terms

LinkOut - more resources