. 2014 Jun;6(6):519-26.
doi: 10.1038/nchem.1920. Epub 2014 Apr 28.

Bioorthogonal cyclization-mediated in situ self-assembly of small-molecule probes for imaging caspase activity in vivo

Affiliations

Bioorthogonal cyclization-mediated in situ self-assembly of small-molecule probes for imaging caspase activity in vivo

Deju Ye et al. Nat Chem. 2014 Jun.

Abstract

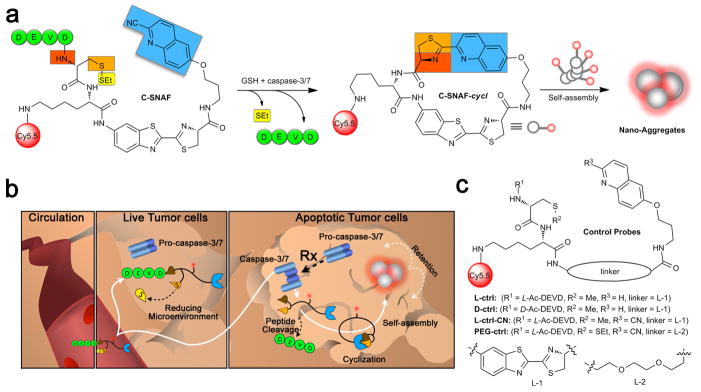
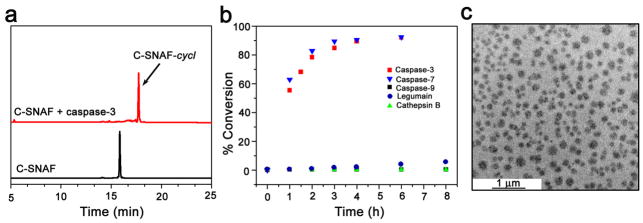
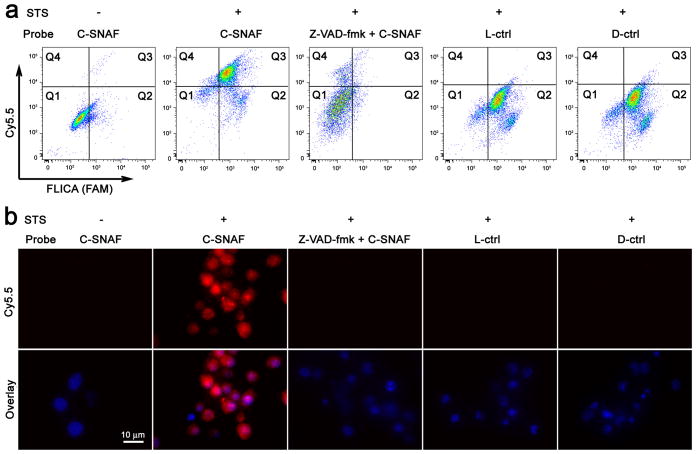
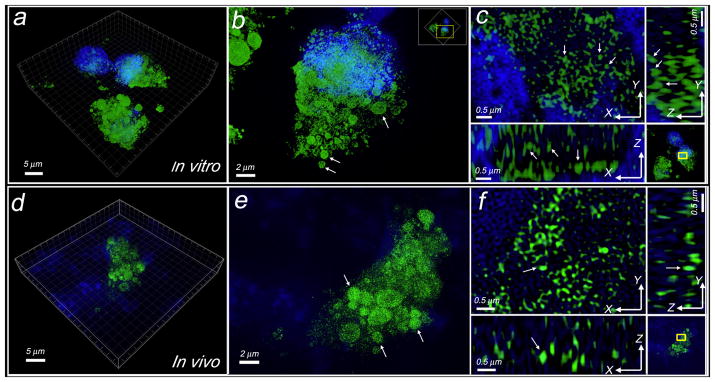
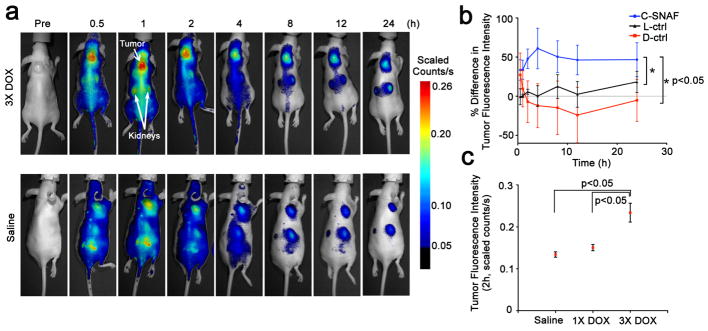
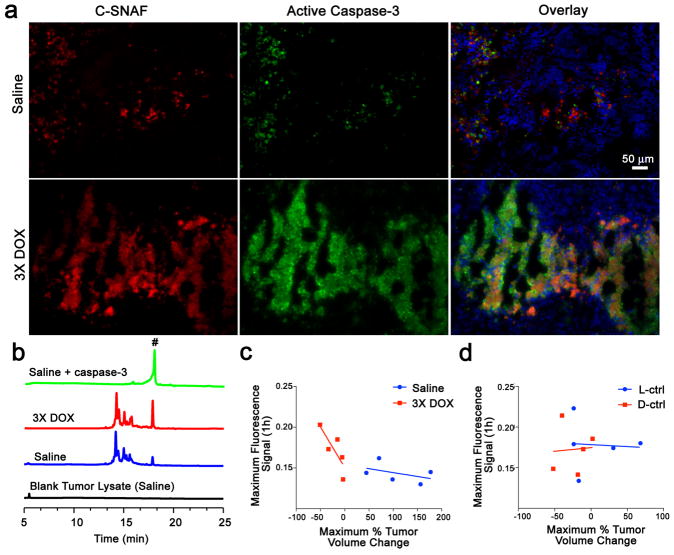
Directed self-assembly of small molecules in living systems could enable a myriad of applications in biology and medicine, and already this has been used widely to synthesize supramolecules and nano/microstructures in solution and in living cells. However, controlling the self-assembly of synthetic small molecules in living animals is challenging because of the complex and dynamic in vivo physiological environment. Here we employ an optimized first-order bioorthogonal cyclization reaction to control the self-assembly of a fluorescent small molecule, and demonstrate its in vivo applicability by imaging caspase-3/7 activity in human tumour xenograft mouse models of chemotherapy. The fluorescent nanoparticles assembled in situ were imaged successfully in both apoptotic cells and tumour tissues using three-dimensional structured illumination microscopy. This strategy combines the advantages offered by small molecules with those of nanomaterials and should find widespread use for non-invasive imaging of enzyme activity in vivo.


Figures

Figure 1
Figure 1. Illustration of the mechanism of in vivo imaging of caspase-3/7 activity in human tumor xenograft mouse models by C-SNAF
a, Proposed caspase-3/7 and reduction-controlled conversion of C-SNAF to C-SNAF-cycl through the bioorthogonal intramolecular cyclization reaction, followed by self-assembly into nano-aggregates in situ. b, The fate of C-SNAF in vivo is dependent upon the tumor response to chemotherapy. Following intravenous administration, C-SNAF extravasates into tumor tissue due to its small size. In live tumor tissue that is not responding to applied chemotherapy, the pro-caspase-3 is inactive, and the DEVD capping peptide remains intact. C-SNAF can freely diffuse away from live tumor tissue, leading to low fluorescence. In apoptotic tumor tissue, pro-caspase-3 is converted to active caspase-3, and C-SNAF can readily enter cells due to the compromised membrane integrity associated with apoptosis. After DEVD cleavage by active caspase-3 and disulfide reduction, C-SNAF undergoes macrocyclization and in situ nano-aggregation, leading to enhanced probe retention and high fluorescence. c, The chemical structures of control probes L-ctrl, D-ctrl, L-ctrl-CN and PEG-ctrl.
Figure 2
Figure 2. In vitro characterization of caspase-3/7-sensitive nano-aggregation fluorescent probe (C-SNAF)
a, HPLC traces of C-SNAF in water (black, TR = 15.8 min) and the incubation of C-SNAF (25 μM) with recombinant human caspase-3 (4.9 × 10⁻³ U/ml) for 24 h at 37 °C in the caspase-3 buffer (red, TR = 17.7 min). b, The enzymatic reaction kinetics and specificity studies by longitudinal monitoring of % conversion of C-SNAF (25 μM) to C-SNAF-cycl after incubation with equal masses (0.735 μg/ml) of recombinant human caspase-3, caspase-7, caspase-9, cathepsin B, or legumain. c, TEM image of nano-aggregates after incubation C-SNAF (50 μM) with recombinant human caspase-3 (4.9 × 10⁻³ U/mL) overnight at 37 °C in caspase-3 buffer; scale bar, 1 μm.
Figure 3
Figure 3. Imaging of caspase-3/7 activity in STS-treated cancer cells with C-SNAF
a, Flow cytometry analysis of viable and STS-induced apoptotic HeLa cells after incubation with C-SNAF (2 μM), C-SNAF (2 μM) with caspase inhibitor Z-VAD-fmk (50 μM), or L-ctrl or D-ctrl (2 μM). The quadrants Q are defined as Q1 = fluorescent inhibitor of caspase (FLICA) negative/Cy5.5 negative, Q2 = FLICA positive/Cy5.5 negative, Q3 = FLICA positive/Cy5.5 positive and Q4 = FLICA negative/Cy5.5 positive. Representative dot plots show that FLICA-positive apoptotic cells were efficiently labeled by C-SNAF, but not by control probes (L-ctrl and D-ctrl), demonstrating a good correlation between C-SNAF and FLICA. b, Fluorescence microscopy imaging of C-SNAF (2 μM) labeling STS-induced apoptotic HeLa cells. Cells were stained with nuclear dye Hoechst 33342 (blue). Extensive fluorescence (red) was observed only in the apoptotic cells, indicating specific intracellular accumulation of C-SNAF after caspase-3/7-triggered macrocyclization and nano-aggregation.
Figure 4
Figure 4. Three-dimensional structured illumination microscopy (3D-SIM) imaging of self-assembled fluorescent nano-aggregates in cells
a, Representative 3D-SIM image of self-assembled fluorescent nanoparticles in apoptotic cells incubated with C-SNAF-SIM (2 μM). Cells were co-stained with DAPI (4′,6-diamidino-2-phenylindole). Green color indicates the probe fluorescence, and blue indicates nucleus. b, Enlarged 3D-SIM image of a single cell in a. Arrows show the probe accumulated in the apoptotic bodies. Yellow box indicates the enlarged area. c, Enlarged 3D-SIM images in 3D-slice in cells. Upper left shows XY slices; upper right and lower left show orthogonal YZ and XZ views of the processed Z-stack. Yellow box indicates the enlarged area. Arrows show the views of representative individual fluorescent dots in XY, YZ, and XZ panels, with a diameter of ~150 nm at X or Y dimension. d, Representative 3D-SIM image of tissue slice (10 μm thick) from DOX-treated tumor after i.v. injection of C-SNAF-SIM (20 nmol). Tissues were co-stained with DAPI. e, Enlarged 3D-SIM image in apoptotic tumor tissues from d. Arrows show the probe accumulated in the therapy-induced apoptotic bodies. f, Enlarged 3D-SIM images in 3D-slice in tumor tissues. Arrows show the same fluorescent dot observed in XY, YZ, and XZ panels.
Figure 5
Figure 5. Noninvasive imaging of apoptosis in tumor-bearing mice treated with DOX
a, Longitudinal fluorescence imaging of 3X DOX- (top) and saline-treated (bottom) tumor-bearing mice with C-SNAF (5 nmol). Anatomical locations of the tumor and kidneys are indicated by white arrows. Mice bearing subcutaneous HeLa tumors received either i.v. chemotherapy of 8 mg/kg DOX or saline once every 4 days for a total of three times. Two days following the final treatment, C-SNAF (5 nmol) in saline was administered i.v. and whole-body fluorescence was monitored longitudinally using a Maestro fluorescence imager. b, The percent difference in tumor fluorescence intensity between 3X DOX and saline treatment groups over the course of imaging for C-SNAF (blue, n = 5), L-ctrl (black, n = 5), and D-ctrl (red, n = 5). * p<0.05 between groups indicates by brackets. c, A comparison of the average tumor fluorescence intensity at 2 h after C-SNAF administration in saline-treated mice (n = 4), or following a single (1X DOX) or three DOX treatments (3X DOX) in the same animals (n = 4). * p<0.05 between groups indicated by brackets. All the error bars indicate standard deviation.
Figure 6
Figure 6. Correlation of enhanced C-SNAF macrocyclization and tissue retention with caspase-3 activation and tumor response to therapy
a, Immunohistochemical analysis of tumors resected from mice treated with saline (top) or 3X DOX (bottom) 4 h following administration of C-SNAF (5 nmol, red). Tissue sections were co-stained for nuclei (blue) and active caspase-3 (green). b, HPLC traces (675 nm detection) of blank tumor lysate from saline treatment (black), and C-SNAF (5 μM) following 24 h incubation with tumor lysate from mice after treatment with saline (blue), 3X DOX (red), or saline with addition of caspase-3 (green, 4.9 × 10⁻³ U/mL). Peak # indicates C-SNAF-cycl. c, Plots of the maximum tumor fluorescence 1 h after C-SNAF administration versus the maximum tumor size change following 3X DOX revealed a strong correlation for DOX-treated mice (red, Pearson’s r = −0.9, p<0.05), but no correlation for saline-treated animals (blue, r = −0.2, p>0.05). d, Plots of the maximum tumor fluorescence 1 h after control probes administration versus the maximum tumor size change following 3X DOX revealed no significant correlation (p>0.05) for both the L-ctrl (blue, r = −0.3) and D-ctrl (red, r =0.2). The regression lines are shown in solid.

References

    1. Whitesides GM, Mathias JP, Seto CT. Molecular self-assembly and nanochemistry: a chemical strategy for the synthesis of nanostructures. Science. 1991;254:1312–1319. - PubMed
    1. Capito RM, Azevedo HS, Velichko YS, Mata A, Stupp SI. Self-assembly of large and small molecules into hierarchically ordered sacs and membranes. Science. 2008;319:1812–1816. - PubMed
    1. O’Leary LE, Fallas JA, Bakota EL, Kang MK, Hartgerink JD. Multi-hierarchical self-assembly of a collagen mimetic peptide from triple helix to nanofibre and hydrogel. Nat Chem. 2011;3:821–828. - PubMed
    1. Gazit E. Bioinspired chemistry: Diversity for self-assembly. Nat Chem. 2010;2:1010–1011. - PubMed
    1. Yang Z, Liang G, Xu B. Enzymatic hydrogelation of small molecules. Acc Chem Res. 2008;41:315–326. - PubMed

Publication types