. 2014 May 21;9(5):e98380.
doi: 10.1371/journal.pone.0098380. eCollection 2014.

Rapid renal alpha-1 antitrypsin gene induction in experimental and clinical acute kidney injury

Affiliations

Rapid renal alpha-1 antitrypsin gene induction in experimental and clinical acute kidney injury

Richard A Zager et al. PLoS One. .

Abstract

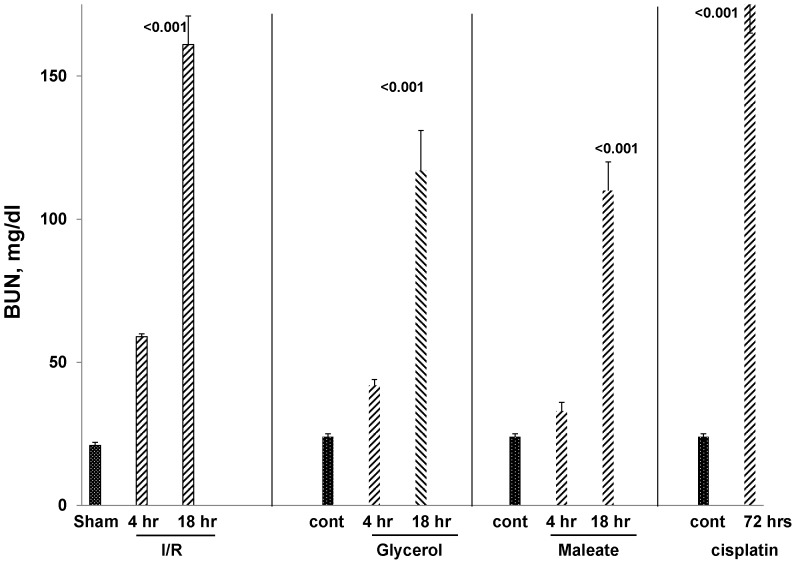
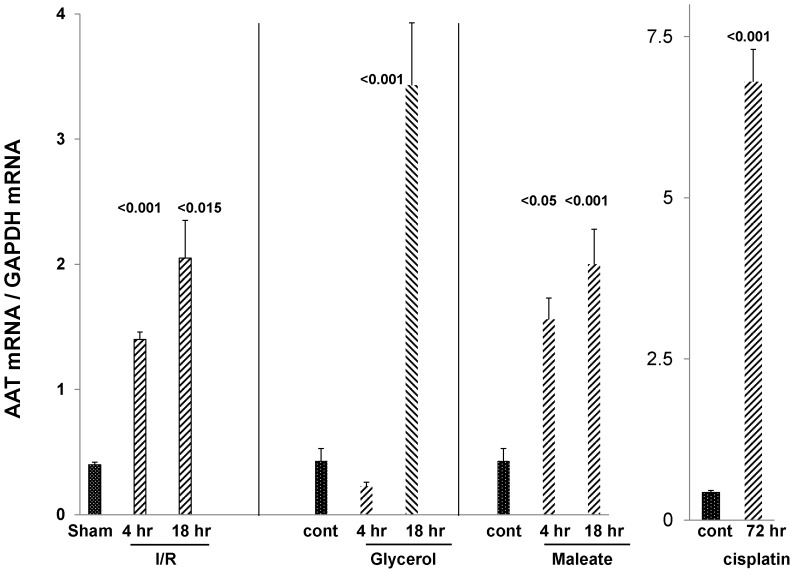
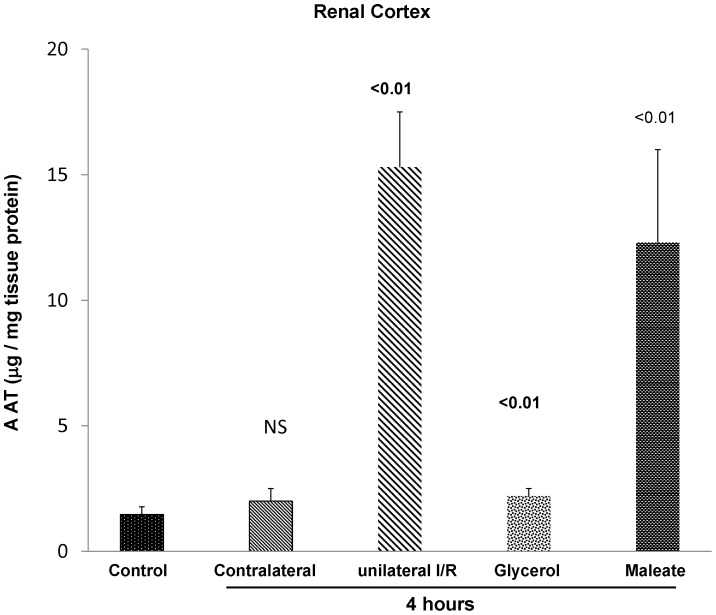
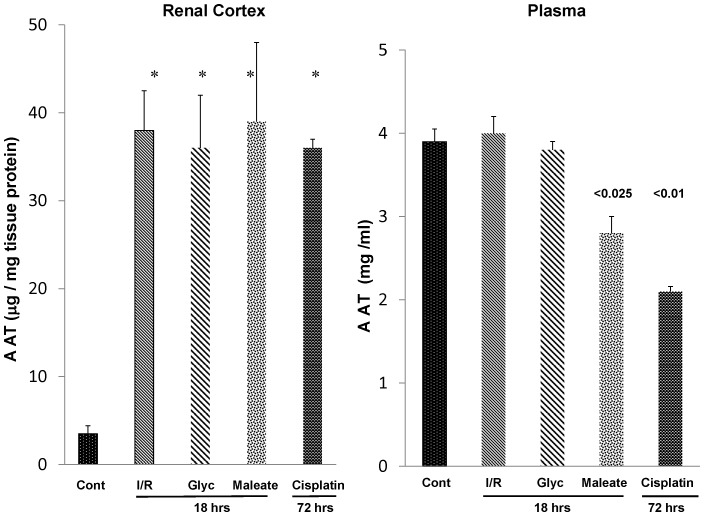
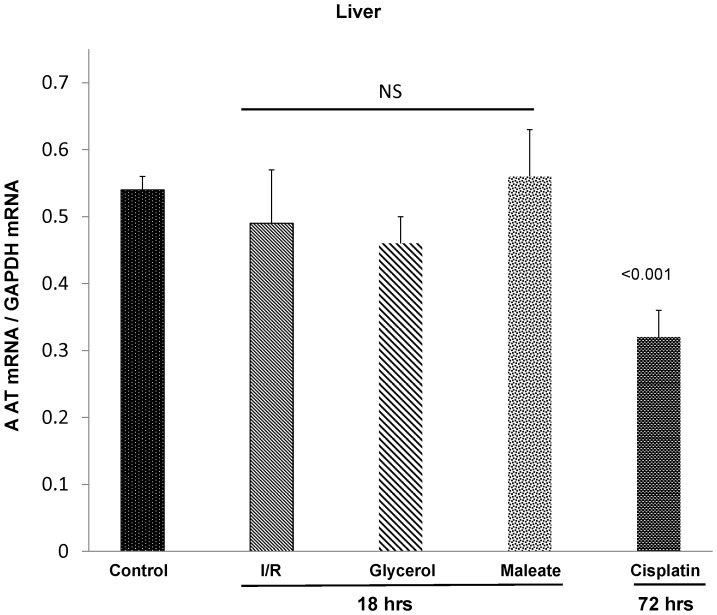
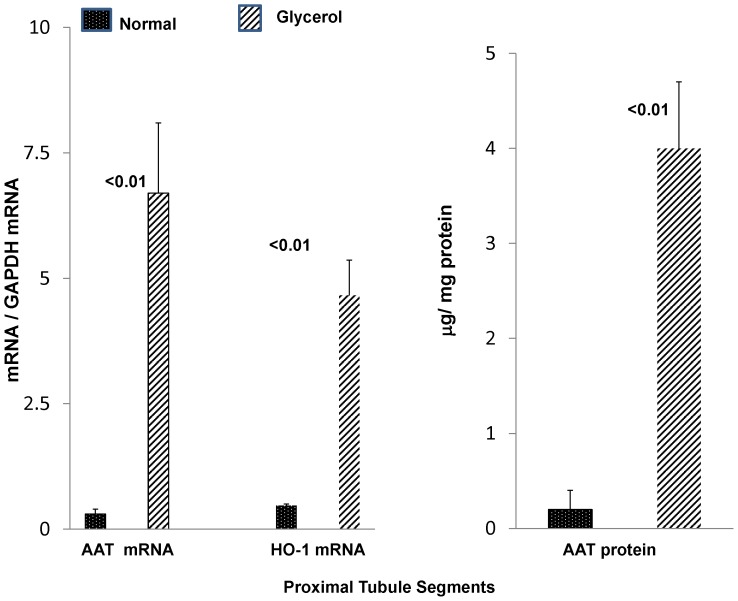
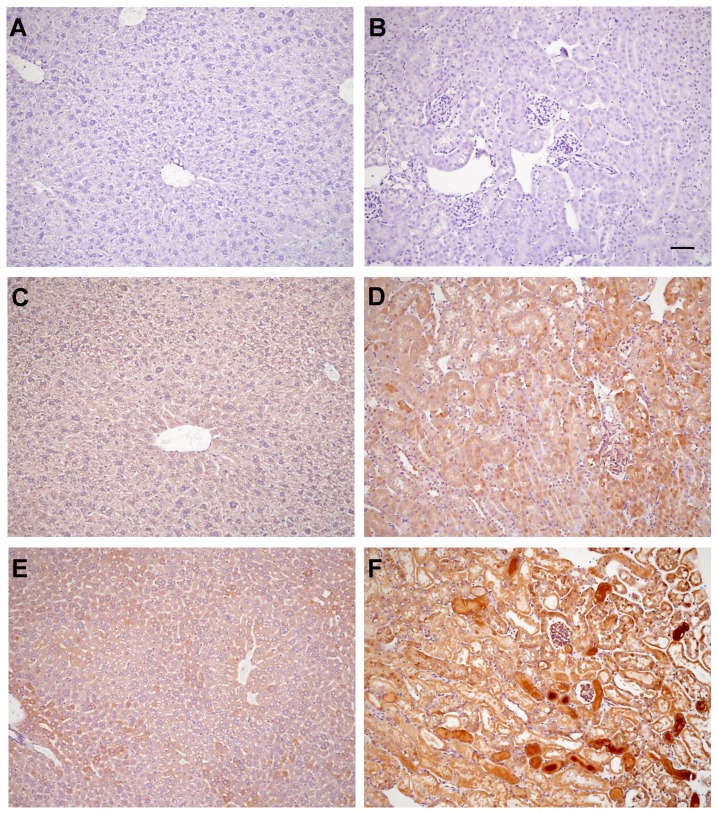
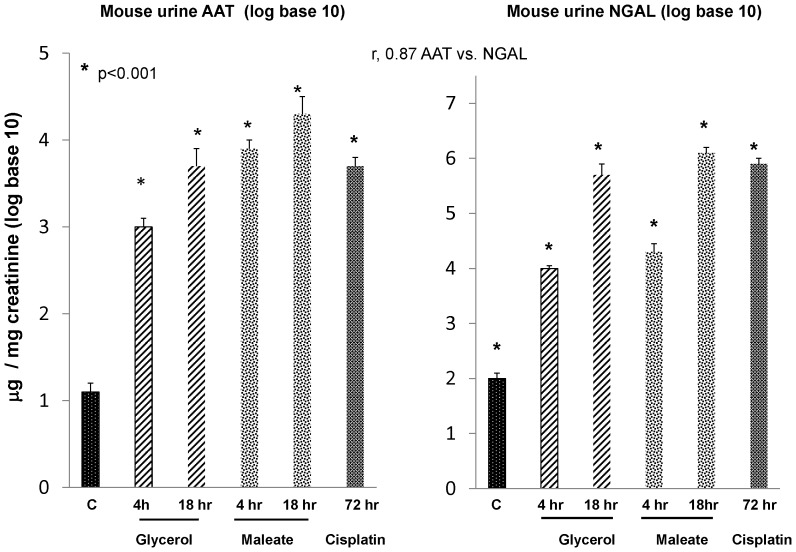
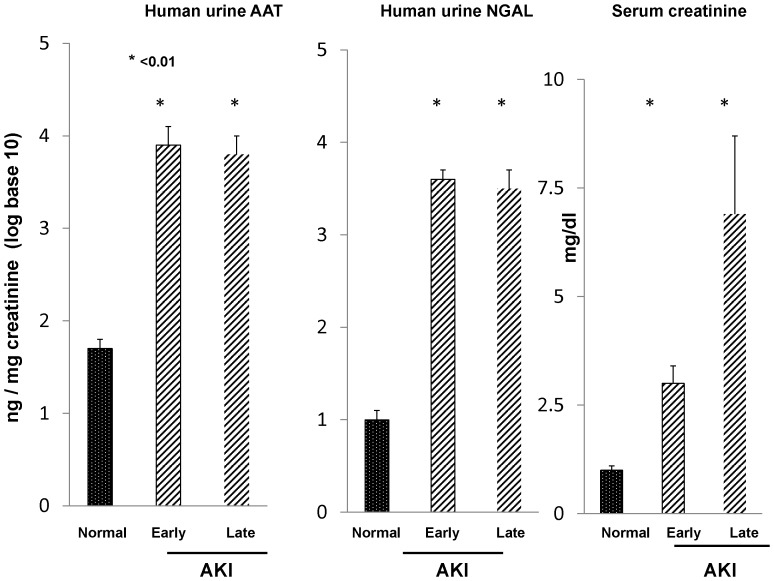
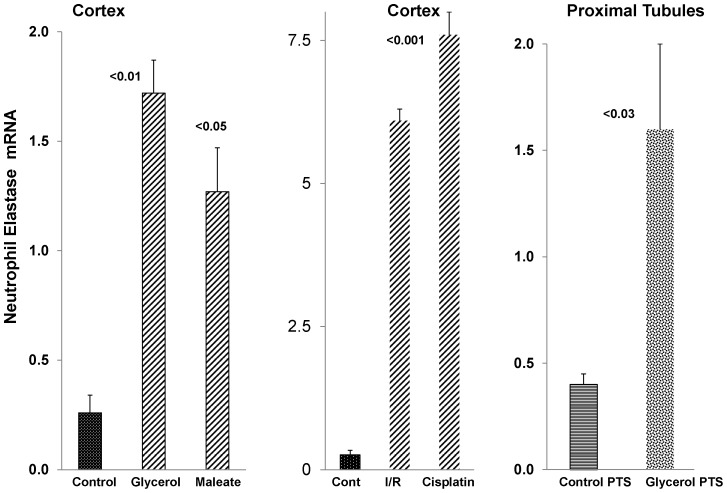
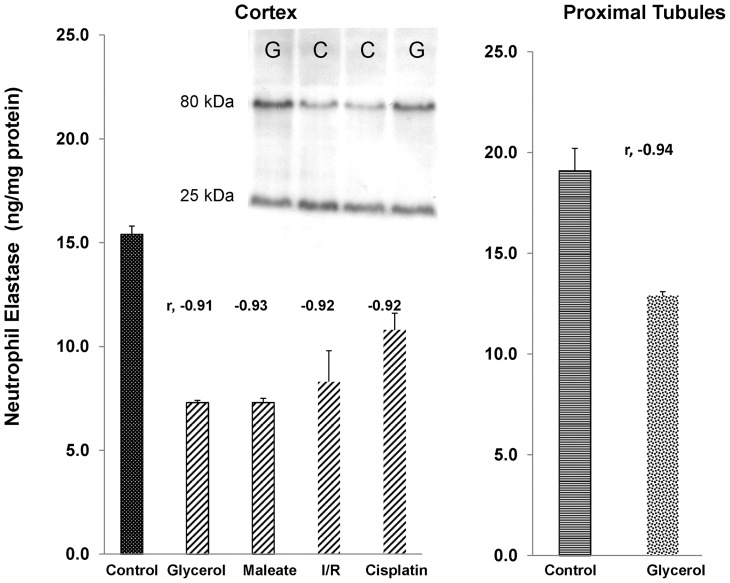
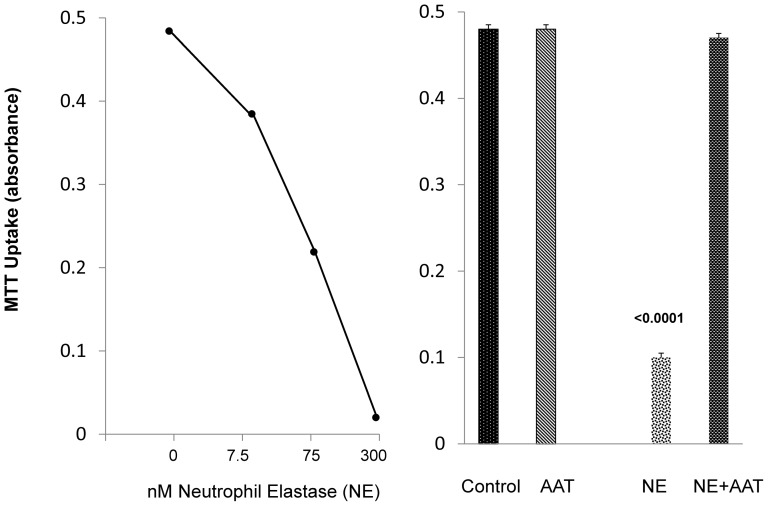
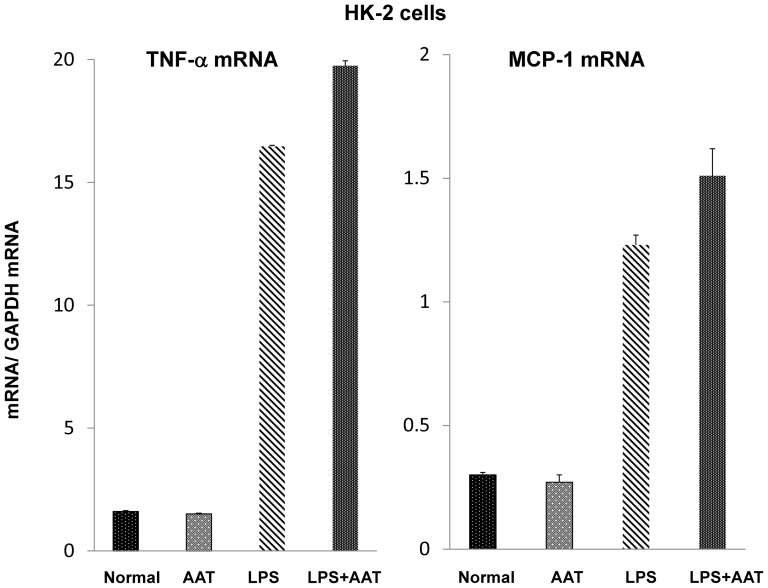
Alpha-1-antitrypsin (AAT) is a hepatic stress protein with protease inhibitor activity. Recent evidence indicates that ischemic or toxic injury can evoke selective changes within kidney that resemble a hepatic phenotype. Hence, we tested the following: i) Does acute kidney injury (AKI) up-regulate the normally renal silent AAT gene? ii) Does rapid urinary AAT excretion result? And iii) Can AAT's anti-protease/anti-neutrophil elastase (NE) activity protect injured proximal tubule cells? CD-1 mice were subjected to ischemic or nephrotoxic (glycerol, maleate, cisplatin) AKI. Renal functional and biochemical assessments were made 4-72 hrs later. Rapidly following injury, 5-10 fold renal cortical and isolated proximal tubule AAT mRNA and protein increases occurred. These were paralleled by rapid (>100 fold) increases in urinary AAT excretion. AKI also induced marked increases in renal cortical/isolated proximal tubule NE mRNA. However, sharp NE protein levels declines resulted, which strikingly correlated (r, -0.94) with rising AAT protein levels (reflecting NE complexing by AAT/destruction). NE addition to HK-2 cells evoked ∼95% cell death. AAT completely blocked this NE toxicity, as well as Fe induced oxidant HK-2 cell attack. Translational relevance of experimental AAT gene induction was indicated by ∼100-1000 fold urinary AAT increases in 22 AKI patients (matching urine NGAL increases). We conclude: i) AKI rapidly up-regulates the renal cortical/proximal tubule AAT gene; ii) NE gene induction also results; iii) AAT can confer cytoprotection, potentially by blocking/reducing cytotoxic NE accumulation; and iv) marked increases in urinary AAT excretion in AKI patients implies clinical relevance of the AKI- AAT induction pathway.


Conflict of interest statement

Competing Interests: The authors have declared that no competing interests exist.

Figures

Figure 1
Figure 1. Ischemic and nephrotoxic AKI models induced progressive azotemia.
Ischemia/reperfusion (I/R), glycerol induced rhabdomyolysis, and maleate each induced progressive azotemia, as assessed at 4 and 18 hrs post injury induction. Azotemia was assessed only at 72 hrs post cisplatin injection and severe renal failure was observed. Sham  =  sham operated mice, which served as controls for the I/R protocol. Cont  =  control (non operated) mice (n, 5–8 per group; p values vs. sham operated or control mice).
Figure 2
Figure 2. Each of the AKI models induced a marked up-regulation of AAT mRNA levels in renal cortex.
I/R approximated tripled AAT mRNA within just 4 hrs of injury induction, with a further increase being observed at the 18 hr time point. The same pattern was observed with maleate. Glycerol evoked an increase in AAT mRNA, but it was slower in onset (seen at 18 but not 4 hrs post glycerol injection). Massive (15 fold) AAT mRNA increases were observed at 3 days post cisplatin injection.
Figure 3
Figure 3. AKI induces a rapid increase in renal cortical AAT protein levels.
To assess whether the early (4 hr) AKI- induced AAT mRNA increases were associated with prompt increases in AAT protein levels, the latter were assessed by ELISA. In the case of ischemia/reperfusion (I/R) injury, unilateral ischemia was induced such that the contralateral kidney could serve as a surgical control. Each of the models was associated with significant AAT protein increases, approximately paralleling the relative degrees of AAT mRNA induction, as shown in Fig. 2. Of note is that the contralateral kidney in the unilateral I/R protocol did not manifest an increase in AAT protein levels (discussed in text).
Figure 4
Figure 4. AKI leads to sustained increases in renal cortical AAT protein levels in the absence of any increase in AAT plasma levels.
As shown in the left hand panel, approximate 10–20 fold renal cortical AAT protein increases were observed at 18 hrs or 72 hrs post AKI induction. These existed in the absence of any increase in plasma AAT levels (right hand panel). In fact, both the maleate and the cisplatin models were associated with decreased, not increased, plasma AAT concentrations.
Figure 5
Figure 5. Each of the AKI models failed to increase hepatic AAT mRNA levels.
To demonstrate that the renal AAT increases were not associated with increased hepatic AAT production, hepatic AAT mRNA levels were measured. In no case was an increase in hepatic AAT mRNA levels observed. Corresponding with the suppressed plasma AAT levels in the cisplatin model was a significant reduction in its corresponding hepatic AAT mRNA.
Figure 6
Figure 6. AAT mRNA and protein levels are increased in isolated proximal tubules harvested 18- induced AKI.
To demonstrate that the renal cortical AAT changes were reflective of proximal tubule events, proximal tubules were isolated from either normal mice or mice with glycerol induced AKI. AAT mRNA levels were markedly increased in post glycerol exposed tubules, compared to values observed in control tubules (left panel). For comparison, heme oxygenase 1 (HO-1) mRNA, known to be markedly induced in the glycerol model, was also measured and the degree of increase was less than that seen for AAT mRNA. As shown in the right hand panel, a 20 fold increase in AAT protein levels was observed in post glycerol exposed tubules. In sum, these proximal tubule AAT mRNA and protein levels indicate that the renal cortical AAT mRNA and protein increases reflected, at least in part, proximal tubule events.
Figure 7
Figure 7. Immunohistochemical localization of AAT in liver and kidney.
Panels A and B depict sections from a normal mouse liver and kidney (A, B, respectively) that were stained with an isotype IgG control antibody (1∶250 dilution), serving as negative controls. Panels C and D depict normal liver (C) and normal kidney (D) probed with 1∶250 dilution of anti- mouse AAT. Mild AAT staining was observed, compared to the isotype negative controls. Panel E depicts a liver section from a mouse with glycerol- induced AKI and probed with anti- AAT. No increase in AAT staining is apparent, compared to normal liver (C). Panel F depicts renal cortical AAT staining 18 hrs post induction of glycerol AKI. Marked staining of renal cortical proximal tubule casts and modest cytoplasmic AAT staining within proximal tubules are apparent. The scale bar  = 100 microns.
Figure 8
Figure 8. Each of the experimental AKI models induced prompt and massive increases in urinary AAT protein levels, and these increases were comparable to, or exceeded those, observed for urinary NGAL, a classic AKI biomarker protein.
All values were factored for urinary creatinine concentrations and are presented as log base 10. Massive urinary AAT protein increases were observed, rising from control values of ∼10 to as high as 30,000 µg/mg creatinine within just 4 hrs of AKI induction (left panel). Furthermore, these values were sustained at each of the tested delayed time points. Of note, these AAT increases were as great, if not greater, than those observed for NGAL (right panel), and a strong correlation (r, 0.87) between AAT vs. NGAL levels was observed.
Figure 9
Figure 9. Clinical AKI is associated with massive increases in urinary AAT excretion, and comparable to the increases observed for NGAL.
Urine samples were obtained within 48(“early AKI”) or just prior to the start of renal replacement therapy (late AKI). and assayed for urinary AAT and NGAL. Values are given as AAT/creatinine ratios and are presented as log base 10. As shown in the left hand panel, massive and comparable AAT protein increases were observed in the early and late AKI groups, rising from ∼50 to 20,000 ng/mg creatinine. These increases were highly comparable to those observed for urinary NGAL, as shown in the middle panel. Serum creatinines for these groups at the time of urine collection are presented in the right hand panel.
Figure 10
Figure 10. Neutrophil elastase (NE) mRNA levels in renal cortex and in isolated proximal tubules following acute kidney injury.
At 18∼3–4 fold increases in NE mRNA levels were observed. In contrast, by 18 hrs post ischemic-reperfusion injury or 72 hrs post cisplatin injection, even more dramatic (∼30 fold) NE mRNA elevations were observed. As shown in the right hand section of the figure, NE mRNA levels in isolated tubules harvested from glycerol treated vs control mice demonstrated an approximate 4 fold increase in the glycerol group. These matched the increases seen in post glycerol AKI whole renal cortex. In sum, AKI caused dramatic increases in renal cortical NE mRNA levels, and these almost certainly stemmed, at least in part, from increases in proximal tubules.
Figure 11
Figure 11. Neutrophil elastase protein levels in renal cortex following different models of experimental AKI.
Despite the AKI induced increases in NE mRNA, decreases in NE protein levels were observed. There were striking inverse correlations between NE and AAT protein levels (negative r values shown above each bar). This implies that rising AAT levels led to NE destruction due to covalent binding and subsequent proteolysis , . The insert shows the results of Western blotting of control and post glycerol harvested proximal tubule segments. Injury increased the 80 kDa band (bound NE), and modestly decreased (∼35%) the free NE (25 kDa) band. This led to a doubling of the 80 kDa/25 kDa ratio with injury (see text).
Figure 12
Figure 12. NE mediated cytotoxicity in HK-2 cells, and protection against NE toxicity with AAT.
Addition of purified NE induced dose dependent cytotoxicity in HK-2 cells after 18 hr incubations. This toxicity was completely inhibited by concomitant incubation with AAT.
Figure 13
Figure 13. AAT and protease inhibitors confer protection against Fe mediated oxidant HK-2 cell attack.
After an overnight incubation with either 1/ml of purified human AAT or a protease inhibitory “cocktail”, HK-2 cells were challenged with Fe mediated oxidative stress. The severity of injury was assessed by MTT assay either 4 or 18 hrs post Fe addition. Both AAT and the protease inhibitors (PI; 0.01% and 0.1%) conferred significant protection against the Fe challenge, as indicated by significant preservation of MTT uptake.

Similar articles

Cited by

References

    1. McCullough PA, Shaw AD, Haase M, Bouchard J, Waikar SS, et al. (2013) Diagnosis of acute kidney injury using functional and injury biomarkers: workgroup statements from the tenth Acute Dialysis Quality Initiative Consensus Conference. Contrib Nephrol 182: 13–29. - PubMed
    1. Makris K, Rizos D, Kafkas N, Haliassos A (2012) Neutrophil gelatinase-associated lipocalin as a new biomarker in laboratory medicine. Clin Chem Lab Med 50: 1519–1532. - PubMed
    1. Bonventre JV, Yang L (2010) Kidney injury molecule-1. Curr Opin Crit Care 16: 556–561. - PubMed
    1. Bonventre JV (2008) Kidney Injury Molecule-1 (KIM-1): a specific and sensitive biomarker of kidney injury. Scand J Clin Lab Invest Suppl 241: 78–83. - PubMed
    1. Negishi K, Noiri E, Doi K, Maeda-Mamiya R, Sugaya T, et al. (2009) Monitoring of urinary L-type fatty acid-binding protein predicts histological severity of acute kidney injury. Am J Pathol 174: 1154–1159. - PMC - PubMed

Publication types

MeSH terms