

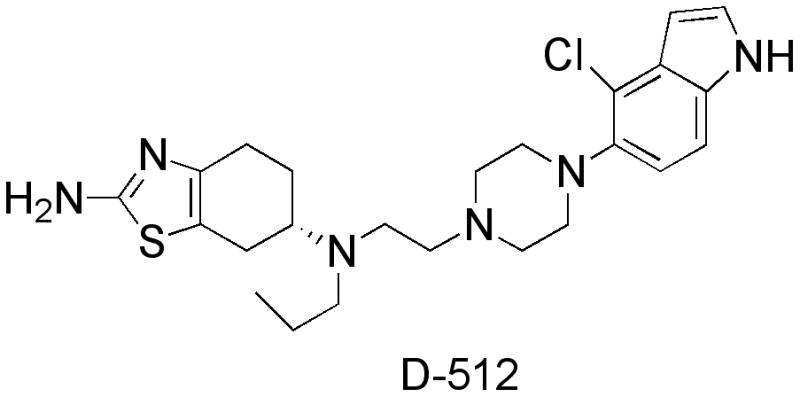
The high-affinity D2/D3 agonist D512 protects PC12 cells from 6-OHDA-induced apoptotic cell death and rescues dopaminergic neurons in the MPTP mouse model of Parkinson's disease
- PMID: 24848702
- PMCID: PMC4177263
- DOI: 10.1111/jnc.12767
The high-affinity D2/D3 agonist D512 protects PC12 cells from 6-OHDA-induced apoptotic cell death and rescues dopaminergic neurons in the MPTP mouse model of Parkinson's disease
Abstract
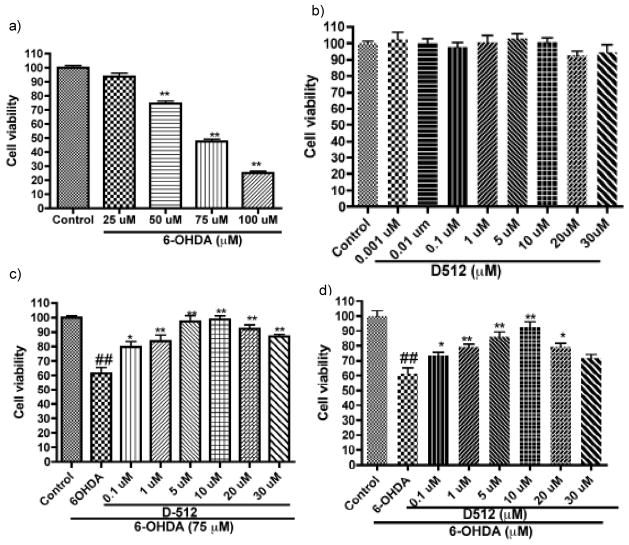
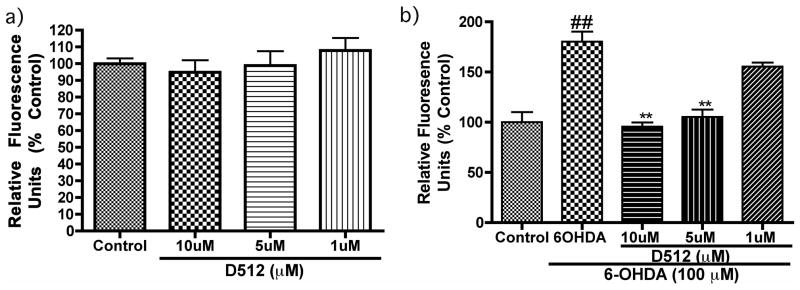
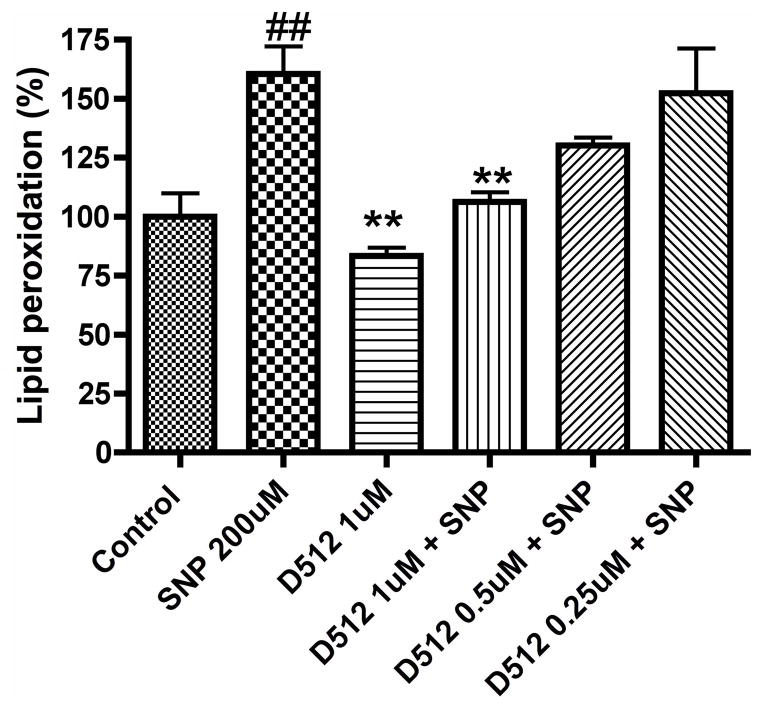
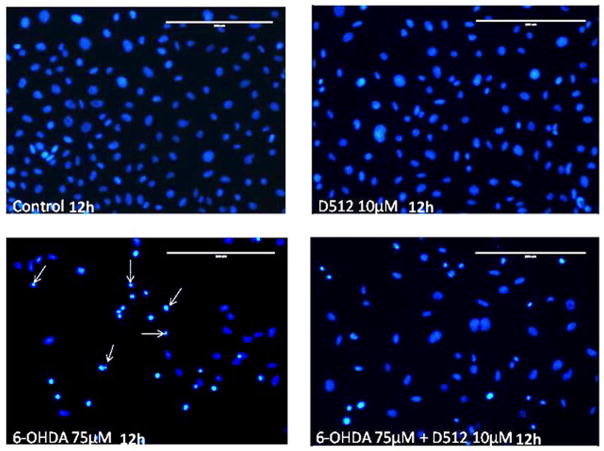
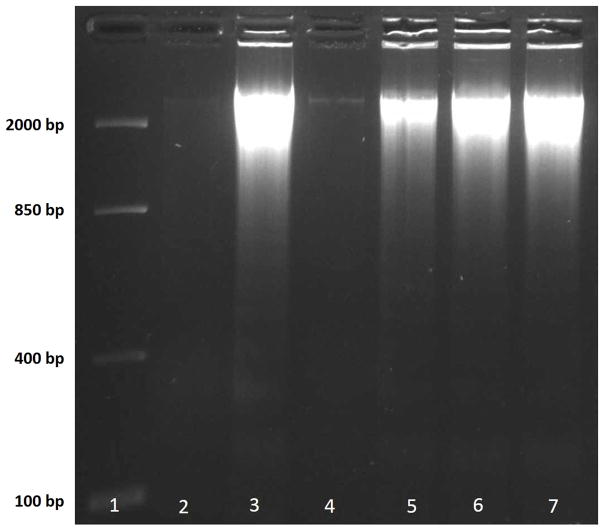
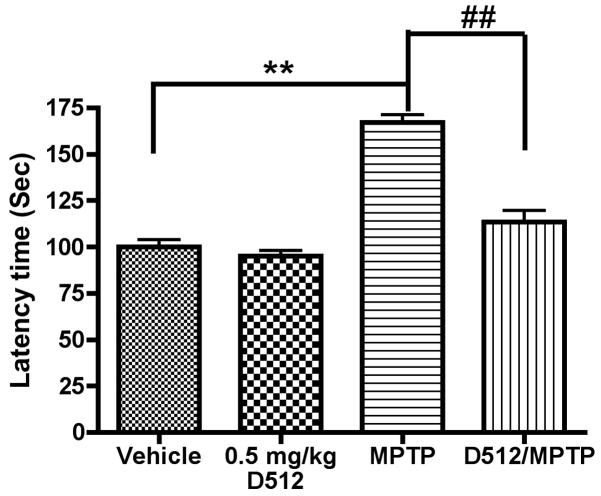
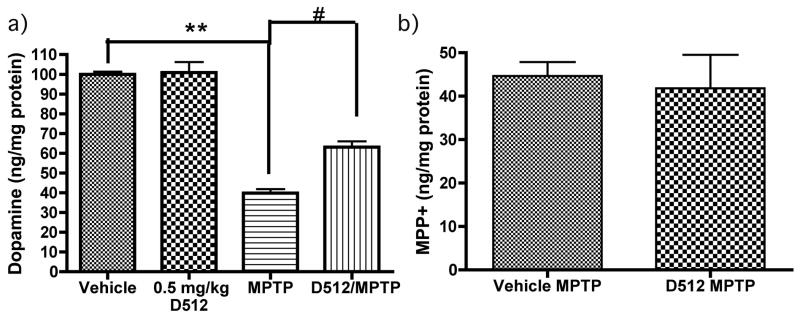
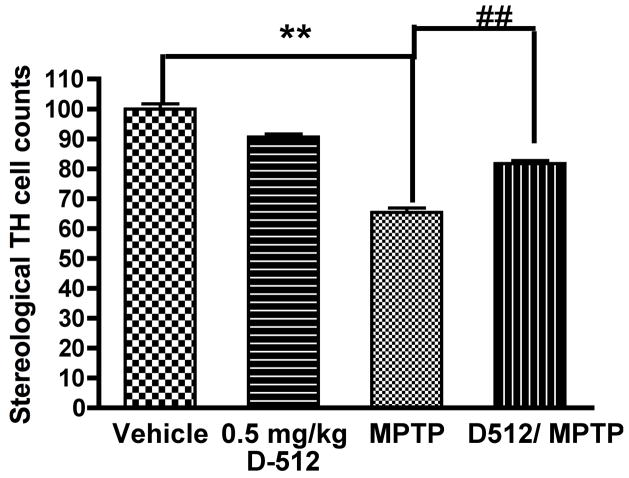
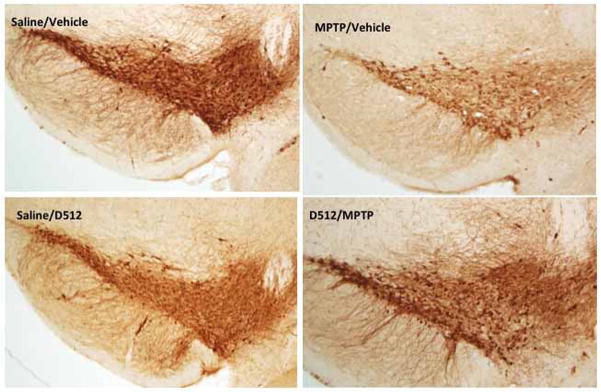
In this study, in vitro and in vivo experiments were carried out with the high-affinity multifunctional D2/D3 agonist D-512 to explore its potential neuroprotective effects in models of Parkinson's disease and the potential mechanism(s) underlying such properties. Pre-treatment with D-512 in vitro was found to rescue rat adrenal Pheochromocytoma PC12 cells from toxicity induced by 6-hydroxydopamine administration in a dose-dependent manner. Neuroprotection was found to coincide with reductions in intracellular reactive oxygen species, lipid peroxidation, and DNA damage. In vivo, pre-treatment with 0.5 mg/kg D-512 was protective against neurodegenerative phenotypes associated with systemic administration of MPTP, including losses in striatal dopamine, reductions in numbers of DAergic neurons in the substantia nigra (SN), and locomotor dysfunction. These observations strongly suggest that the multifunctional drug D-512 may constitute a novel viable therapy for Parkinson's disease.
Keywords: 6-hydroxydopamine; MPTP; Parkinson's disease; multifunctional dopamine agonist; neuroprotection; oxidative stress.
© 2014 International Society for Neurochemistry.
Conflict of interest statement
The authors have no conflicts of interest to declare.
Figures
References
-
- Basma AN, Morris EJ, Nicklas WJ, Geller HM. L-dopa cytotoxicity to PC12 cells in culture is via its autoxidation. J Neurochem. 1995;64:825–832. - PubMed
-
- Beal MF, Matson WR, Storey E, Milbury P, Ryan EA, Ogawa T, Bird ED. Kynurenic acid concentrations are reduced in Huntington’s disease cerebral cortex. Journal of the neurological sciences. 1992;108:80–87. - PubMed
-
- Beal MF, Matson WR, Swartz KJ, Gamache PH, Bird ED. Kynurenine pathway measurements in Huntington’s disease striatum: evidence for reduced formation of kynurenic acid. J Neurochem. 1990;55:1327–1339. - PubMed
-
- Bertler A, Rosengren E. Occurrence and distribution of dopamine in brain and other tissues. Experientia. 1959;15:10–11. - PubMed
Publication types
MeSH terms
Substances
Grants and funding
LinkOut - more resources
Full Text Sources
Other Literature Sources
