

Glucocorticoid-induced reversal of interleukin-1β-stimulated inflammatory gene expression in human oviductal cells
- PMID: 24848801
- PMCID: PMC4029821
- DOI: 10.1371/journal.pone.0097997
Glucocorticoid-induced reversal of interleukin-1β-stimulated inflammatory gene expression in human oviductal cells
Abstract
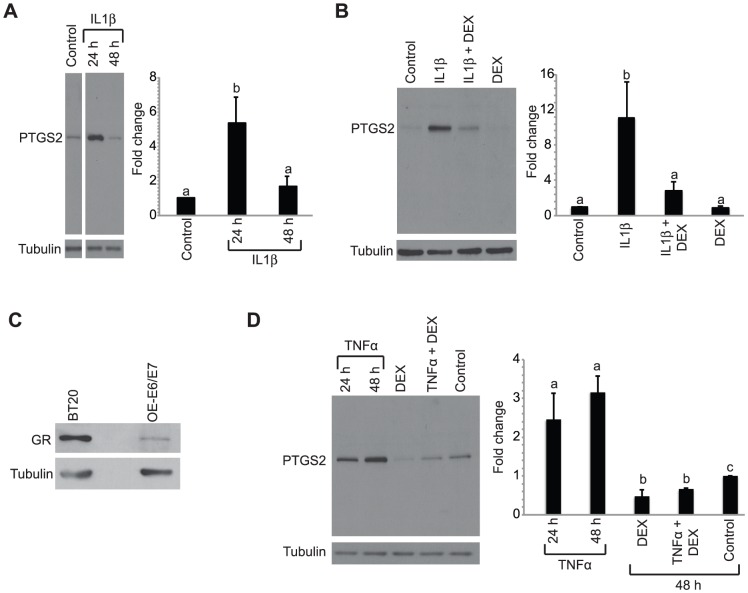
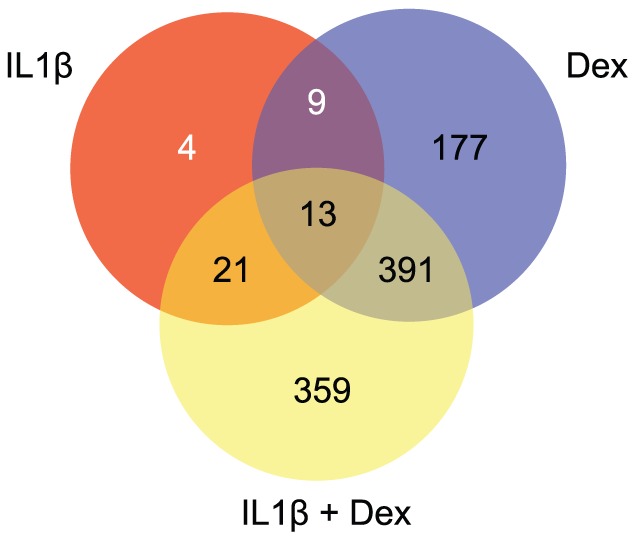
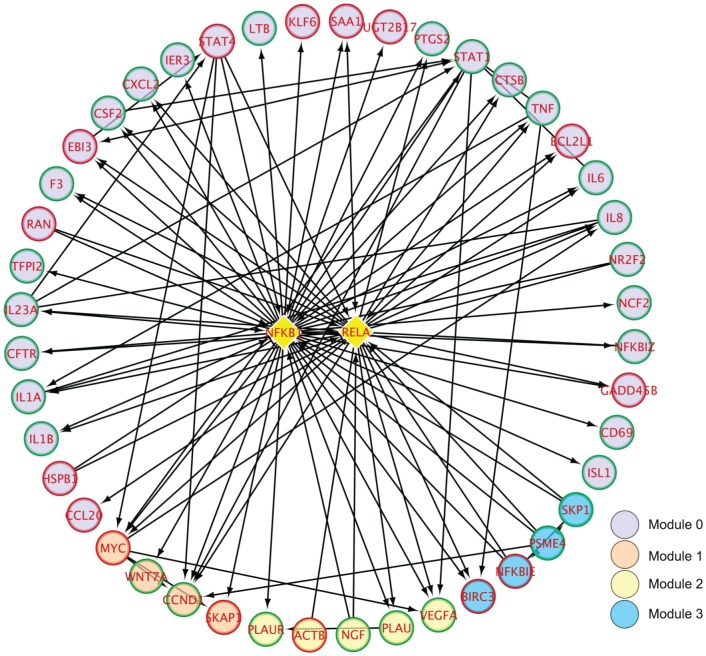
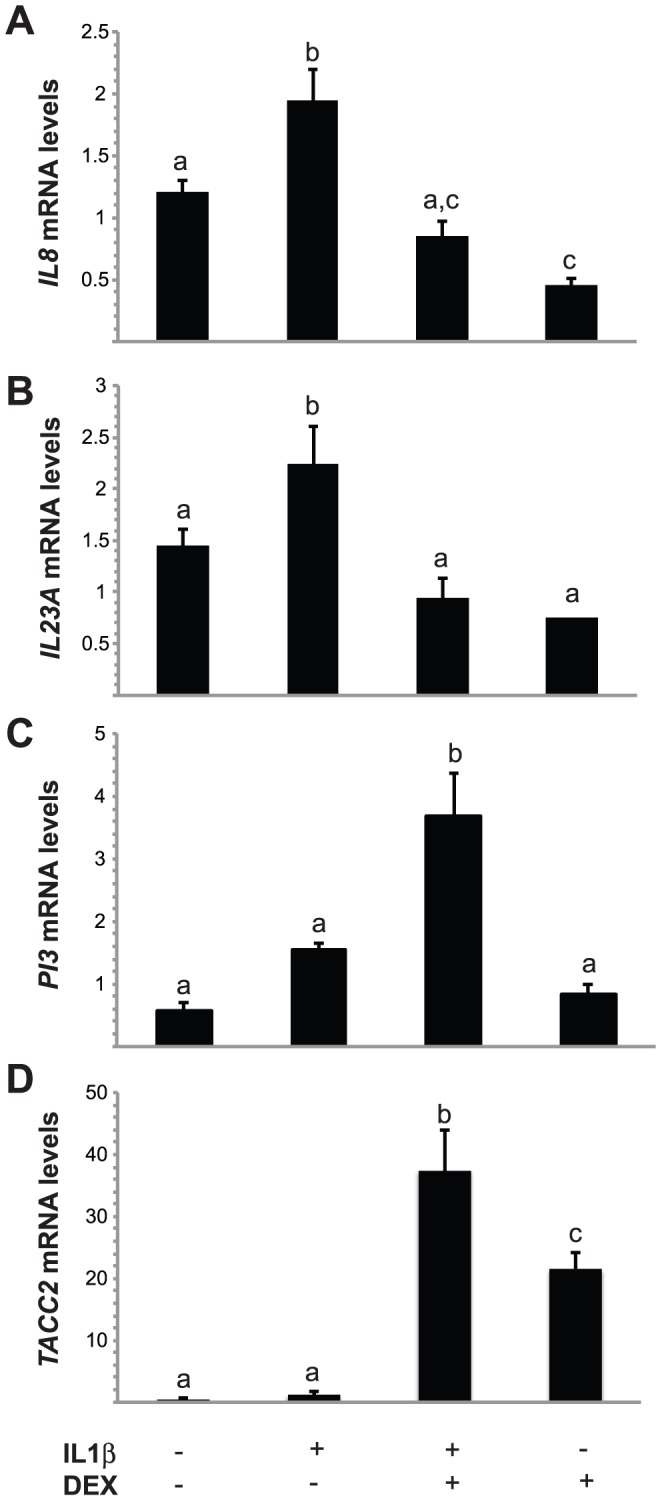
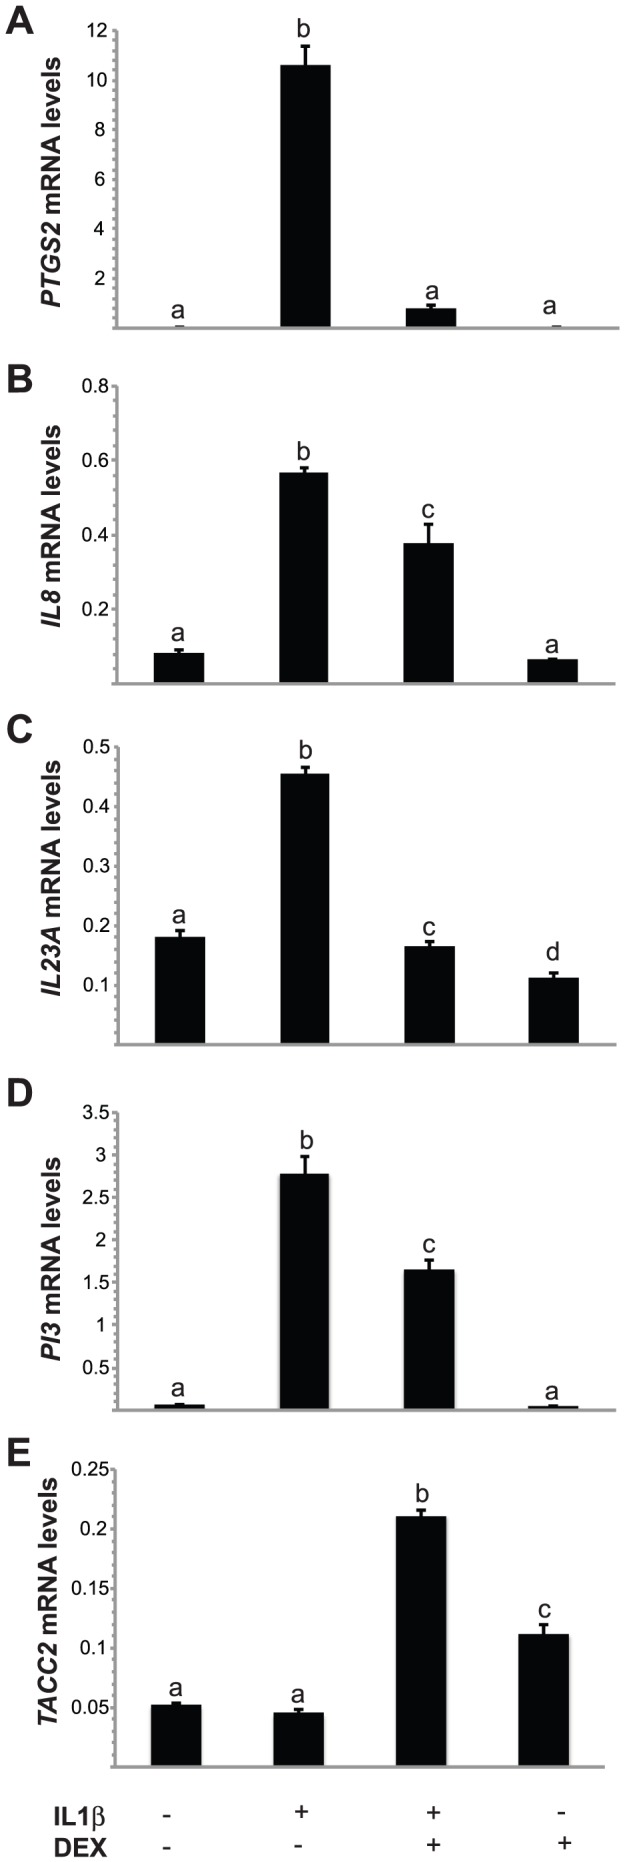
Studies indicate that high-grade serous ovarian carcinoma (HGSOC), the most common epithelial ovarian carcinoma histotype, originates from the fallopian tube epithelium (FTE). Risk factors for this cancer include reproductive parameters associated with lifetime ovulatory events. Ovulation is an acute inflammatory process during which the FTE is exposed to follicular fluid containing both pro- and anti-inflammatory molecules, such as interleukin-1 (IL1), tumor necrosis factor (TNF), and cortisol. Repeated exposure to inflammatory cytokines may contribute to transforming events in the FTE, with glucocorticoids exerting a protective effect. The global response of FTE cells to inflammatory cytokines or glucocorticoids has not been investigated. To examine the response of FTE cells and the ability of glucocorticoids to oppose this response, an immortalized human FTE cell line, OE-E6/E7, was treated with IL1β, dexamethasone (DEX), IL1β and DEX, or vehicle and genome-wide gene expression profiling was performed. IL1β altered the expression of 47 genes of which 17 were reversed by DEX. DEX treatment alone altered the expression of 590 genes, whereas combined DEX and IL1β treatment altered the expression of 784 genes. Network and pathway enrichment analysis indicated that many genes altered by DEX are involved in cytokine, chemokine, and cell cycle signaling, including NFκΒ target genes and interacting proteins. Quantitative real time RT-PCR studies validated the gene array data for IL8, IL23A, PI3 and TACC2 in OE-E6/E7 cells. Consistent with the array data, Western blot analysis showed increased levels of PTGS2 protein induced by IL1β that was blocked by DEX. A parallel experiment using primary cultured human FTE cells indicated similar effects on PTGS2, IL8, IL23A, PI3 and TACC2 transcripts. These findings support the hypothesis that pro-inflammatory signaling is induced in FTE cells by inflammatory mediators and raises the possibility that dysregulation of glucocorticoid signaling could contribute to increased risk for HGSOC.
Conflict of interest statement
Figures

Similar articles
-
BRCA1 Mutation Status and Follicular Fluid Exposure Alters NFκB Signaling and ISGylation in Human Fallopian Tube Epithelial Cells.Neoplasia. 2018 Jul;20(7):697-709. doi: 10.1016/j.neo.2018.05.005. Epub 2018 May 28. Neoplasia. 2018. PMID: 29852322 Free PMC article.
-
Altered expression of inflammation-associated genes in oviductal cells following follicular fluid exposure: implications for ovarian carcinogenesis.Exp Biol Med (Maywood). 2014 Jan;239(1):24-32. doi: 10.1177/1535370213508216. Epub 2013 Nov 1. Exp Biol Med (Maywood). 2014. PMID: 24186266 Clinical Trial.
-
NF-κB-miR-155 axis activation mediates ovulation-induced oncogenic effects in fallopian tube epithelium.Carcinogenesis. 2020 Dec 31;41(12):1703-1712. doi: 10.1093/carcin/bgaa068. Carcinogenesis. 2020. PMID: 32614381
-
Prolonged postovulatory proinflammatory signaling in the fallopian tube epithelium may be mediated through a BRCA1/DAB2 axis.Clin Cancer Res. 2012 Aug 15;18(16):4334-44. doi: 10.1158/1078-0432.CCR-12-0199. Epub 2012 Jul 2. Clin Cancer Res. 2012. PMID: 22753593
-
Exploring the Role of Fallopian Ciliated Cells in the Pathogenesis of High-Grade Serous Ovarian Cancer.Int J Mol Sci. 2018 Aug 24;19(9):2512. doi: 10.3390/ijms19092512. Int J Mol Sci. 2018. PMID: 30149579 Free PMC article. Review.
Cited by
-
Role of the CXCL8-CXCR1/2 Axis in Cancer and Inflammatory Diseases.Theranostics. 2017 Apr 7;7(6):1543-1588. doi: 10.7150/thno.15625. eCollection 2017. Theranostics. 2017. PMID: 28529637 Free PMC article. Review.
-
Cellular models of development of ovarian high-grade serous carcinoma: A review of cell of origin and mechanisms of carcinogenesis.Cell Prolif. 2021 May;54(5):e13029. doi: 10.1111/cpr.13029. Epub 2021 Mar 25. Cell Prolif. 2021. PMID: 33768671 Free PMC article. Review.
-
VEPH1 expression decreases vascularisation in ovarian cancer xenografts and inhibits VEGFA and IL8 expression through inhibition of AKT activation.Br J Cancer. 2017 Apr 11;116(8):1065-1076. doi: 10.1038/bjc.2017.51. Epub 2017 Mar 16. Br J Cancer. 2017. PMID: 28301874 Free PMC article.
-
The hormonal composition of follicular fluid and its implications for ovarian cancer pathogenesis.Reprod Biol Endocrinol. 2014 Jul 6;12:60. doi: 10.1186/1477-7827-12-60. Reprod Biol Endocrinol. 2014. PMID: 24997727 Free PMC article. Review.
-
Mechanisms of High-Grade Serous Carcinogenesis in the Fallopian Tube and Ovary: Current Hypotheses, Etiologic Factors, and Molecular Alterations.Int J Mol Sci. 2021 Apr 23;22(9):4409. doi: 10.3390/ijms22094409. Int J Mol Sci. 2021. PMID: 33922503 Free PMC article. Review.
References
-
- Soslow RA (2008) Histologic subtypes of ovarian carcinoma: an overview. Int J Gynecol Pathol 27: 161–174. - PubMed
-
- Crum CP, Drapkin R, Miron A, Ince TA, Muto M, et al. (2007) The distal fallopian tube: a new model for pelvic serous carcinogenesis. Curr Opin Obstet Gynecol 19: 3–9. - PubMed
-
- Lee Y, Miron A, Drapkin R, Nucci MR, Medeiros F, et al. (2007) A candidate precursor to serous carcinoma that originates in the distal fallopian tube. J Pathol 211: 26–35. - PubMed
-
- Sogaard M, Kjaer SK, Gayther S (2006) Ovarian cancer and genetic susceptibility in relation to the BRCA1 and BRCA2 genes. Occurrence, clinical importance and intervention. Acta Obstet Gynecol Scand 85: 93–105. - PubMed
-
- Piek JM, van Diest PJ, Zweemer RP, Jansen JW, Poort-Keesom RJ, et al. (2001) Dysplastic changes in prophylactically removed Fallopian tubes of women predisposed to developing ovarian cancer. J Pathol 195: 451–456. - PubMed
Publication types
MeSH terms
Substances
Grants and funding
LinkOut - more resources
Full Text Sources
Other Literature Sources
Medical
Molecular Biology Databases
Research Materials
Miscellaneous
