Review
. 2014 Jun;202(6):1196-206.
doi: 10.2214/AJR.14.12502.

Solid renal masses: what the numbers tell us

Affiliations
Review

Solid renal masses: what the numbers tell us

Stella K Kang et al. AJR Am J Roentgenol. 2014 Jun.

Abstract

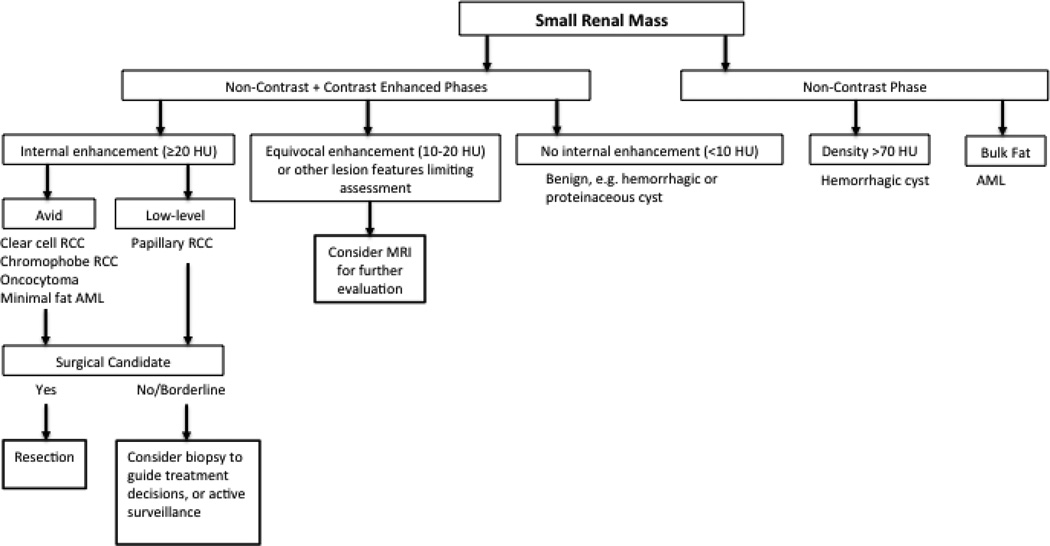
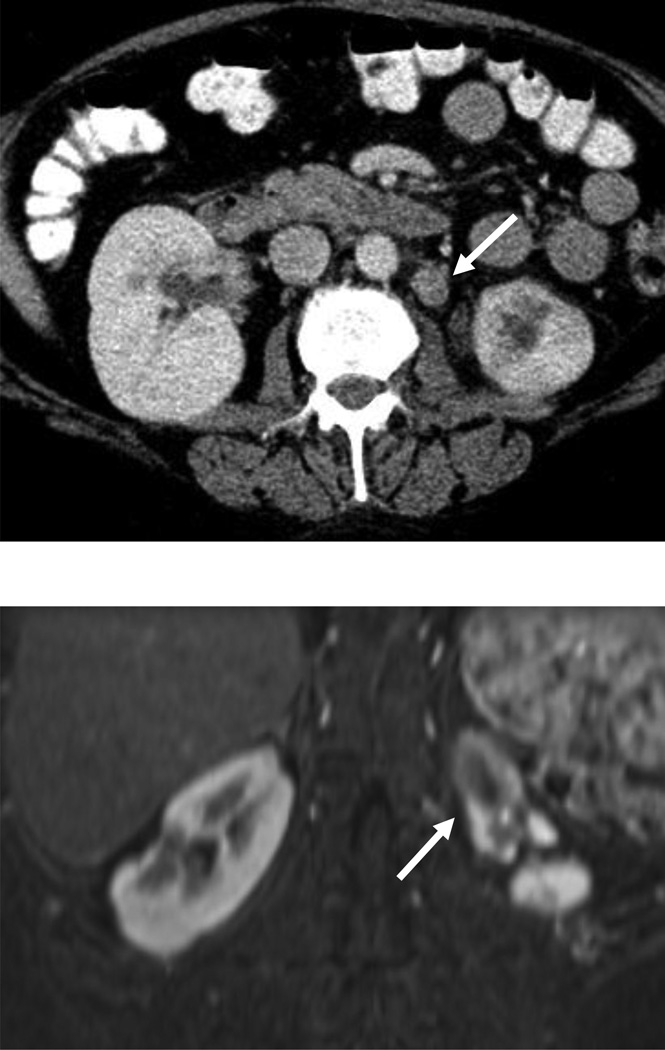
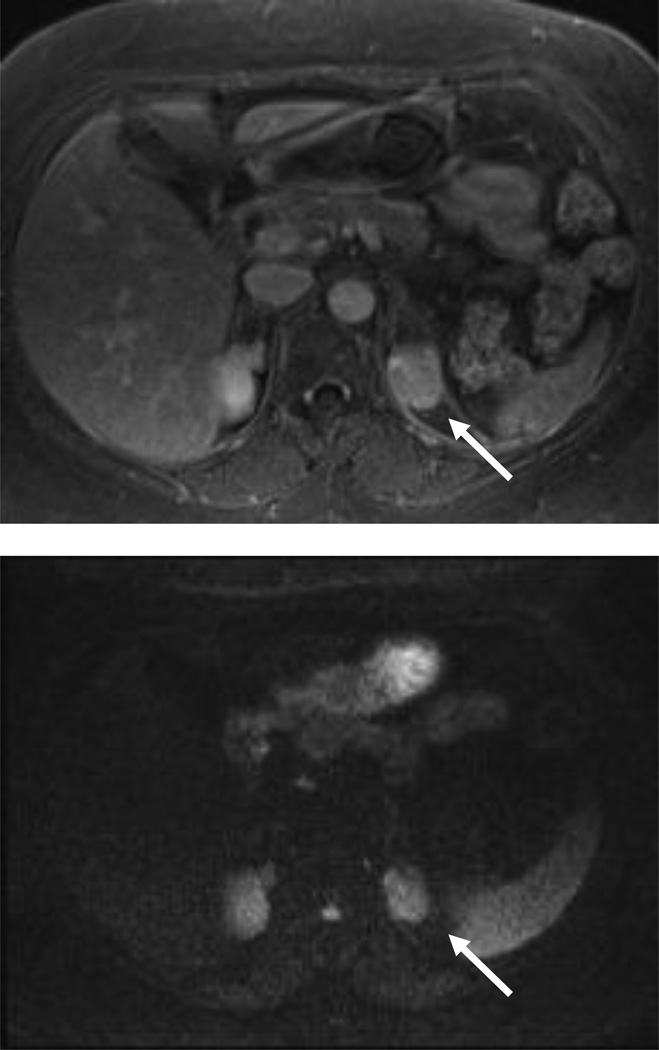
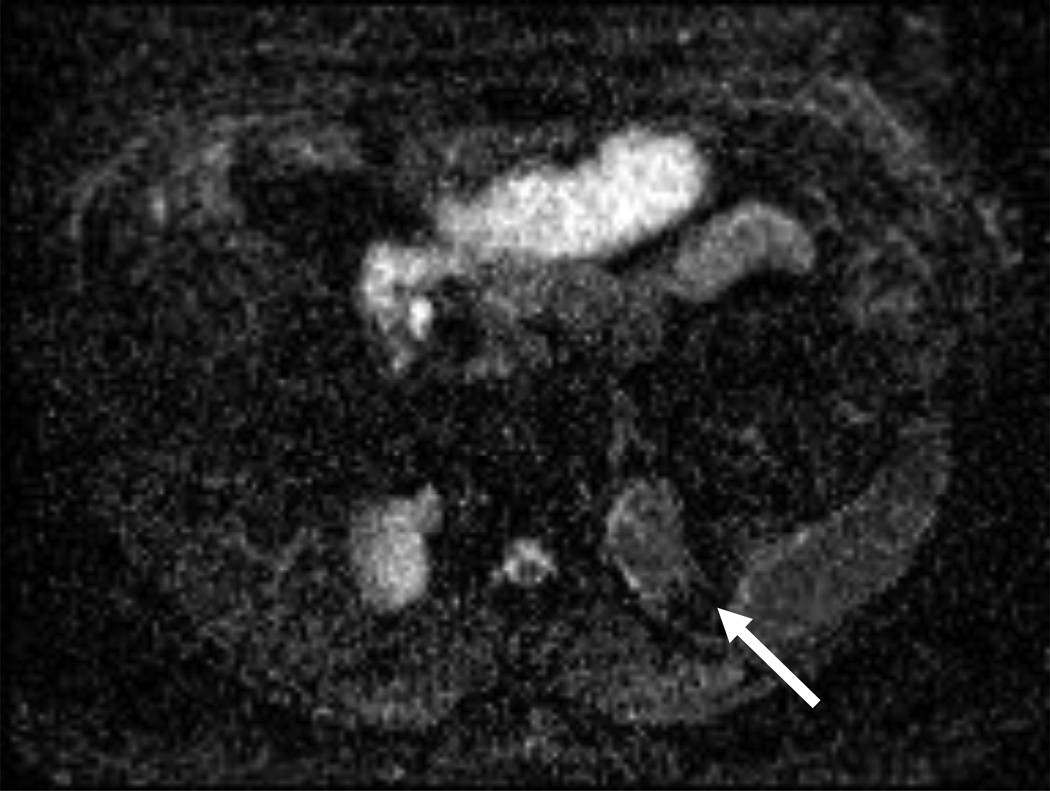
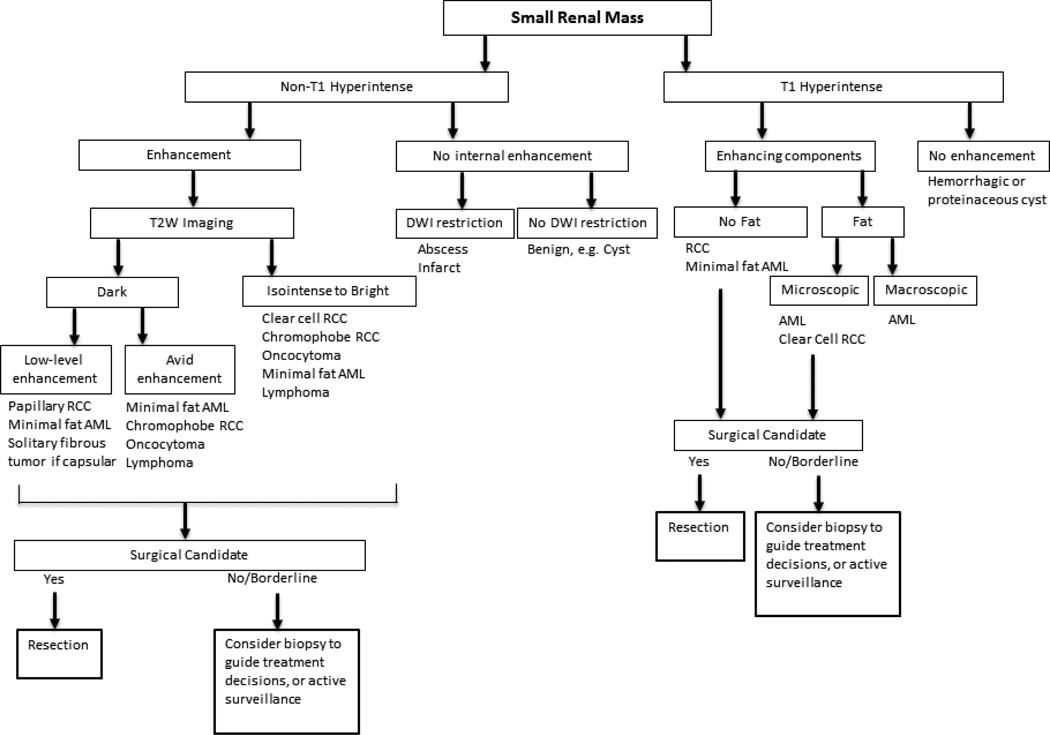
Objective: Solid renal masses are most often incidentally detected at imaging as small (≤ 4 cm) localized lesions. These lesions comprise a wide spectrum of benign and malignant histologic subtypes, but are largely treated with surgical resection given the limited ability of imaging to differentiate among them with consistency and high accuracy. Numerous studies have thus examined the ability of CT and MRI techniques to separate benign lesions from malignancies and to predict renal cancer histologic grade and subtype. This article synthesizes the evidence regarding renal mass characterization at CT and MRI, provides diagnostic algorithms for evidence-based practice, and highlights areas of further research needed to drive imaging-based management of renal masses.

Conclusion: Despite extensive study of morphologic and quantitative criteria at conventional imaging, no CT or MRI techniques can reliably distinguish solid benign tumors, such as oncocytoma and lipid-poor angiomyolipoma, from malignant renal tumors. Larger studies are required to validate recently developed techniques, such as diffusion-weighted imaging. Evidence-based practice includes MRI to assess renal lesions in situations where CT is limited and to help guide management in patients who are considered borderline surgical candidates.


Figures

Figure 1
Figure 1
68-year-old man with vomiting and right upper quadrant pain underwent ultrasound. A, An incidental right upper pole renal mass was demonstrated. B, CT renal mass protocol confirmed a 2 cm solid, enhancing mass without distant abdominopelvic metastases that was found to represent clear cell RCC at surgical pathology.
Figure 1
Figure 1
68-year-old man with vomiting and right upper quadrant pain underwent ultrasound. A, An incidental right upper pole renal mass was demonstrated. B, CT renal mass protocol confirmed a 2 cm solid, enhancing mass without distant abdominopelvic metastases that was found to represent clear cell RCC at surgical pathology.
Figure 2
Figure 2
Diagnostic and management algorithm for small renal mass using CT.
Figure 3
Figure 3
54 year-old woman with a left renal mass at CT and clinical diagnosis of pyelonephritis. A and B, CT with and without contrast shows apparent left upper pole mass with hypoenhancement relative to renal parenchyma. C, Enlarged retroperitoneal lymph nodes are also present. D and E, Dynamic contrast-enhanced MRI one week later shows slightly smaller lesion, with corticomedullary differentiation internally, and continued hypoenhancement relative to parenchyma in the nephrographic phase. F and G, Lesion also demonstrates marked restricted diffusion with loss of signal on corresponding ADC map. Focal pyelonephritis was diagnosed and resolved at follow-up MRI.
Figure 3
Figure 3
54 year-old woman with a left renal mass at CT and clinical diagnosis of pyelonephritis. A and B, CT with and without contrast shows apparent left upper pole mass with hypoenhancement relative to renal parenchyma. C, Enlarged retroperitoneal lymph nodes are also present. D and E, Dynamic contrast-enhanced MRI one week later shows slightly smaller lesion, with corticomedullary differentiation internally, and continued hypoenhancement relative to parenchyma in the nephrographic phase. F and G, Lesion also demonstrates marked restricted diffusion with loss of signal on corresponding ADC map. Focal pyelonephritis was diagnosed and resolved at follow-up MRI.
Figure 4
Figure 4
Diagnostic and management algorithm for small renal mass using MRI* *The provided diagnoses are favored given lesion characteristics, but overlap remains between benign lesions and RCC.
Figure 5
Figure 5
67 year old man with hypoattenuating left renal mass at CT underwent further evaluation with MRI. A, CT with and without contrast shows a hypoattenuating left renal mass (25 HU), with borderline enhancement internally. B, At MRI, coronal HASTE shows lesion to be predominantly T2 dark. C, Axial T1 weighted imaging demonstrates hyperintense, layering posterior component. D, MRI subtraction images show anterior enhancing soft tissue and confirms nonenhancing, posteriorly layering hemorrhage. Papillary RCC was diagnosed at surgical pathology.
Figure 5
Figure 5
67 year old man with hypoattenuating left renal mass at CT underwent further evaluation with MRI. A, CT with and without contrast shows a hypoattenuating left renal mass (25 HU), with borderline enhancement internally. B, At MRI, coronal HASTE shows lesion to be predominantly T2 dark. C, Axial T1 weighted imaging demonstrates hyperintense, layering posterior component. D, MRI subtraction images show anterior enhancing soft tissue and confirms nonenhancing, posteriorly layering hemorrhage. Papillary RCC was diagnosed at surgical pathology.

Similar articles

Cited by

References

    1. Gill IS, Aron M, Gervais DA, Jewett MA. Clinical practice. Small renal mass. N Engl J Med. 2010;362:624–634. - PubMed
    1. Jayson M, Sanders H. Increased incidence of serendipitously discovered renal cell carcinoma. Urology. 1998;51:203–205. - PubMed
    1. Campbell SC, Novick AC, Belldegrun A, et al. Guideline for management of the clinical T1 renal mass. The Journal of urology. 2009;182:1271–1279. - PubMed
    1. Huang WC, Levey AS, Serio AM, et al. Chronic kidney disease after nephrectomy in patients with renal cortical tumours: a retrospective cohort study. The lancet oncology. 2006;7:735–740. - PMC - PubMed
    1. Hollingsworth JM, Miller DC, Daignault S, Hollenbeck BK. Rising incidence of small renal masses: a need to reassess treatment effect. Journal of the National Cancer Institute. 2006;98:1331–1334. - PubMed

Publication types

MeSH terms