Review
. 2014 Jun;271(3):633-52.
doi: 10.1148/radiol.14132232.

CT angiography after 20 years: a transformation in cardiovascular disease characterization continues to advance

Affiliations
Review

CT angiography after 20 years: a transformation in cardiovascular disease characterization continues to advance

Geoffrey D Rubin et al. Radiology. 2014 Jun.

Abstract

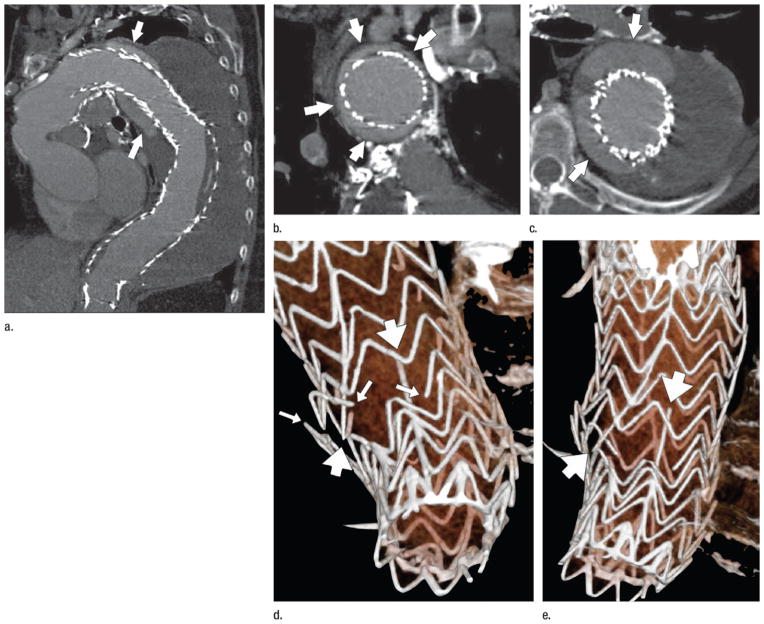
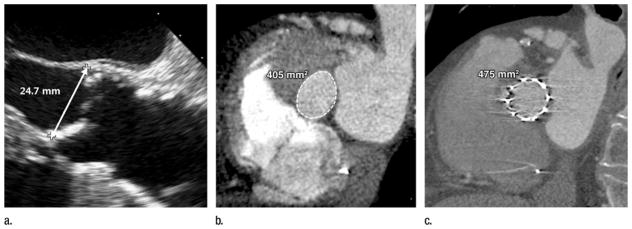
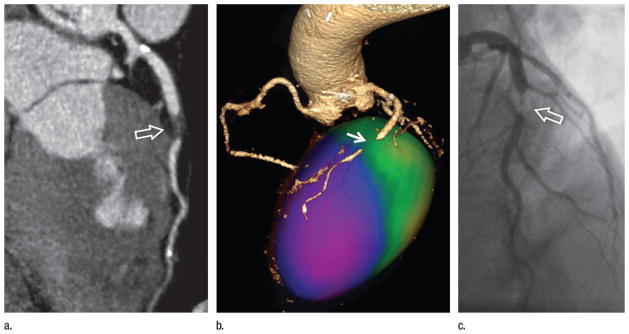
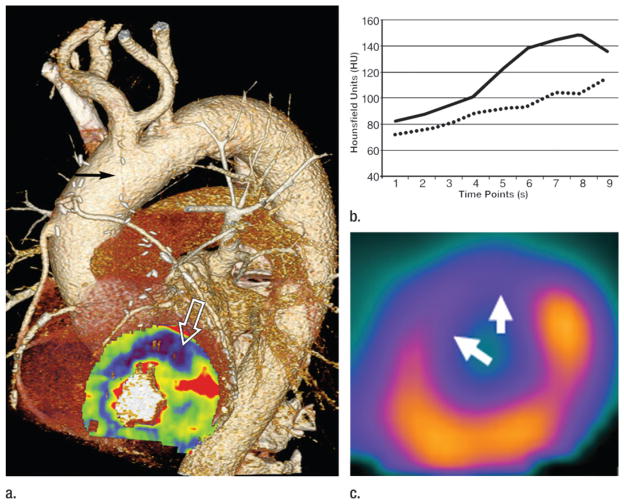
Through a marriage of spiral computed tomography (CT) and graphical volumetric image processing, CT angiography was born 20 years ago. Fueled by a series of technical innovations in CT and image processing, over the next 5-15 years, CT angiography toppled conventional angiography, the undisputed diagnostic reference standard for vascular disease for the prior 70 years, as the preferred modality for the diagnosis and characterization of most cardiovascular abnormalities. This review recounts the evolution of CT angiography from its development and early challenges to a maturing modality that has provided unique insights into cardiovascular disease characterization and management. Selected clinical challenges, which include acute aortic syndromes, peripheral vascular disease, aortic stent-graft and transcatheter aortic valve assessment, and coronary artery disease, are presented as contrasting examples of how CT angiography is changing our approach to cardiovascular disease diagnosis and management. Finally, the recently introduced capabilities for multispectral imaging, tissue perfusion imaging, and radiation dose reduction through iterative reconstruction are explored with consideration toward the continued refinement and advancement of CT angiography.


Conflict of interest statement

Disclosures of Conflicts of Interest: G.D.R. Financial activities related to the present article: none to disclose. Financial activities not related to the present article: HeartFlow stock options, granted more than 36 months prior to publication. Other relationships: none to disclose. J.L. Financial activities related to the present article: personal fees as a consultant to HeartFlow and GE Healthcare. Financial activities not related to the present article: none to disclose. Other relationships: none to disclose. U.J.S. Financial activities related to the present article: none to disclose. Financial activities not related to the present article: grants from Bayer, Bracco, GE, Medrad, and Siemens; travel paid by Bayer; institution received payment for preparation of educational materials from GE; workstations and software from Siemens and Medrad. Other relationships: none to disclose. D.F. Author stated no relevant conflicts of interest to disclose. S.N. Financial activities related to the present article: none to disclose. Financial activities not related to the present article: none to disclose. Other relationships: consultant to Carestream and advisory board for Fovia and EchoPixel.

Figures

Figure 1
Figure 1
CT angiography evolution. (a) Renal arterial CT angiogram obtained in December 1991. Nine centimeters of longitudinal coverage required a 30-second spiral scan using 3-mm beam collimation. At that time, shaded surface displays were the only means for 3D display. Maximum intensity projection and volume rendering required offline processing, the latter on highly specialized computing systems. (Reprinted, with permission, from reference .) (b) With the introduction of four-row multidetector CT in 1998, it was possible to image the entirety of the aortoiliac system from thoracic inlet through the inguinal canal in a single acquisition. This volume-rendered CT angiogram was acquired in 28 seconds using a 4 × 2.5-mm helical scan and illustrates a calcified aortoiliac atheromata and an infrarenal abdominal aortic aneurysm. (Reprinted, with permission, from reference .) (c) Volume-rendered CT angiogram acquired in 2001 with a single 21-second 16 × 1.25-mm helical scan encompasses the arterial system from extracranial circulation through pedal arteries. The speed of acquisition increased approximately 25-fold over the 10 years since the first spiral CT angiogram in 1991.
Figure 2
Figure 2
Acute type A dissection in a 45-year-old man. (a–c) Transverse CT images show (a) irregular linear opacities (arrowheads) at the level of the aortic root, (b) no dissection flap in the mid ascending aorta, and (c) a dissection flap (arrow) between a true and false lumen in the distal ascending aorta. (d) Volume-rendered image depicts an extensive dissection, with proximal portion of dissection flap torn off and prolapsing onto and through the aortic valve (arrowheads). Arrow = dissection flap in the distal ascending aorta. In the absence of ECG-gating these nuanced findings would not be visible. (Reprinted, with permission, from reference .)
Figure 3
Figure 3
Limited intimal tear of the ascending aorta. (a) Top: CT angiograms acquired without ECG gating show motion-related irregularity and blurring of ascending aorta. Bottom: ECG-gated CT angiograms obtained 12 hours later reveal an intimal flap in the proximal ascending aorta (arrowhead) consistent with an undermined edge of a limited intimal tear. Immediately superior, the edges of the limited intimal tear (large arrows) and bulging of the disrupted aortic wall (small arrows) are evident. These subtle details are not visible without ECG gating. (b) Volume rendering shows the luminal side of the 6-cm-long lesion. A small undermined flap (arrows) indicates the beginning of the tear, which extends superiorly into the proximal arch. Dotted line = borders of the tear. (Reprinted, with permission, from reference .)
Figure 4
Figure 4
Rupturing aortic aneurysm with IMH. (a) Transverse nonenhanced CT sections demonstrate a 6-cm descending aortic aneurysm (A). IMH (open arrow) is present at inferior margin of the aneurysm associated with displaced intimal calcification (thin arrow) and directly contiguous with hemorrhage in the middle mediastinum (thick arrows). (b) Oblique thin-slab MIP of a CT angiogram shows the IMH (open arrow) at the inferior margin of the aneurysm (A) and the long track of blood (solid arrows) extending through the mediastinum and into the pleural space where a large hematoma (H) occupies nearly half of the right hemithorax and is distinct from lesser-attenuating pleural fluid and enhanced atelectatic right lung. (Reprinted, with permission, from reference .)
Figure 5
Figure 5
Schematic of aortic dissection variants. (a) The layers of the normal extrapericardial thoracic aortic wall consist of the intima, the media, and the adventitia. Most of the substance of the aortic wall is media (gray). Both the intima and the adventitia (drawn schematically as black inner and outer contours of the aortic wall) are not visible at CT. All dissection variants have abnormal media in common. (b) Classic aortic dissection occurs within the outer third of the medial layer, resulting in two channels of blood flow. Note that the tissue separating the true and false lumen is mostly made of media tissue, and correctly should be termed the intimomedial flap (in lieu of intimal flap). (c) When the separation plane within the media is filled with stationary blood, instead of flowing blood, this is an IMH. (d) A limited intimal tear is a partial thickness tear (arrowheads) through the intima and inner portion of the media, exposing the residual media/adventitia, which tends to “bulge out” (arrows) relative to the remainder of the aortic circumference. (Reprinted, with permission, from reference .)
Figure 6
Figure 6
Images in a 19-year-old basketball player with pain in legs when running the court. Diagnosis at CT angiography is popliteal entrapment syndrome. (a) Volume-rendered CT angiogram obtained in forced plantar flexion against resistance (stress) demonstrates occlusions of the popliteal arteries bilaterally (arrows) with minimal opacification of the crural arteries distally. (b) Volume rendering of same data as in a using an alternate opacity transfer function displays the lower leg muscles. The popliteal arteries are obscured but arrows mark their identical position as in a, indicating a medial course relative to the medial heads of the gastrocnemius muscles. (c) Volume-rendered CT angiogram in relaxed, neutral position demonstrates normal-appearing popliteal and crural arteries. (d) Stress and (e) relaxed views show the aberrant medial course of popliteal arteries (arrows) relative to the medial heads of the gastrocnemius muscles bilaterally (*).
Figure 7
Figure 7
Right lower extremity ischemia with gangrenous toes. (a) MIP and (b) multipath curved planar reformation from lower extremity CT angiogram depict extensive bilateral atherosclerotic disease. Arterial supply to the right lower extremity is severely compromised by 3-cm-long common iliac artery occlusion (1), 2-cm-long high-grade stenosis of the external iliac artery (2), and proximal through midsuperficial femoral artery stenoses (curved arrow with 5-cm-long occlusion) (3). Right posterior tibial artery is occluded at its origin, but is reconstituted by the peroneal artery above the ankle (4), resulting in two-vessel runoff across the ankle. Arterial supply to the left lower extremity is compromised by a 75% stenosis of the proximal common iliac artery (5), greater than 90% stenoses of the external iliac artery (6, 7), 3-cm-long midsuperficial femoral artery occlusion (8), and moderate distal superficial femoral artery stenosis (9). Left anterior tibial artery is occluded 10 cm distal to its origin but is reconstituted by the peroneal artery above the ankle (11) to provide two-vessel runoff across the ankle. Legions obscured on MIP by heavy arterial wall calcifications (1, 2, 5, 6, 7) are not obscured by calcium and better displayed on the multipath curved planar reformation. Because the displayed plane of a curved planar reformation is always through the vessels of interest, the representation of nonvascular structures may not follow standard anatomic relationships. An example of this is the ovoid opacities lateral to the popliteal artery, which represent portions of the lateral femoral condyles and lateral aspect of the tibial plateaus.
Figure 8
Figure 8
(a) Sagittal 1.5-cm-thick MIP through an abdominal aortic aneurysm (AAA) depicts an oblique course of intravascular US catheter (open arrows) through the proximal aneurysm neck (solid arrows). A mean intravascular US catheter obliquity of 21.1° ± 2.6 relative to median axis of proximal neck lumen explains the tendency of intravascular US to depict greater eccentricity and maximal transverse diameter of the AAA neck relative to orthogonal CT sections. (b) Intravascular US and (c) double oblique CT reformation orthogonal to median axis of the lumen at level of the anticipated proximal fixation site for a stent-graft. Arrows = left renal vein. Aortic eccentricity is 0.68 for intravascular US and 1.00 for CT. Although intravascular US catheter obliquity may be the cause of some major axis overestimation, US artifacts substantially hinder confident wall identification. Note the distance between perceived anterior wall of the aorta and left renal vein on US image. CT image demonstrates that the majority of these high-level echoes are artifacts. (d) Following automated extraction of the median centerline of the aorto-right iliac lumen, oblique reformations are generated every millimeter along length of the centerline. The average diameter derived from cross-sectional area is plotted relative to longitudinal position along the centerline. CT sections correspond to the positions indicated by arrows on the plot. A small localized peak in the curve indicates origin of right and inferior-most renal artery (left arrow). Diameter immediately distal to this peak is 18 mm, corresponding to proximal stent-graft fixation site. Middle long arrow indicates maximum aneurysm diameter, which is 58 mm. Transition from aorta to right common iliac artery is apparent from an abrupt transition in cross-sectional area (short arrow). Further reduction in diameter indicates the origin of the right external iliac artery, which is 8 mm at its origin (right long arrow). In addition to providing measurements of diameter, distance along the path is readily ascertained, providing information on aortic segment lengths. (Part d reprinted, with permission, from reference .)
Figure 9
Figure 9
CT angiography performed 1 year after deployment of a stent-graft to treat a descending thoracic aortic aneurysm. (a) Curved planar reformation demonstrates the proximal aspect of the stent-graft displaced from the lesser curve of the distal aortic arch, allowing contrast-enhanced luminal blood to flow around the stent-graft initially, inferiorly, and then in a spiraling direction distally (arrows). (b) Coronal oblique reformation through the distal aortic arch demonstrates poor fixation of the stent-graft at this level, with the endoleak channel filling over the majority of the aortic circumference (arrows). (c) Transverse section through a 9-cm descending aortic aneurysm (the aneurysm had measured 7 cm at the time of stent-graft deployment). Arrows mark the endoleak within the aneurysm sac. (d, e) Volume-rendered images of the distal stent-graft illustrate multiple fractures of the transverse stent rings (thin arrows) and the distal longitudinal strut (thick arrows). The ends of the fractured strut and rings are highly distracted, suggesting substantial motion and loss of structural integrity on the distal device, possibly leading to migration of the proximal device and the subsequent type IA endoleak and aneurysm expansion. (Reprinted, with permission, from reference .)
Figure 10
Figure 10
(a, b) Images obtained before TAVR with (a) transthoracic echocardiography and (b) multidetector CT in an 84-year-old man with severe symptomatic aortic stenosis. The annulus measured 24.7 mm at two-dimensional echocardiographic assessment, resulting in a 26-mm transcatheter heart valve being selected (5.31 cm2), despite the annulus measuring 4.0 cm2 at CT, which would typically result in a recommendation of a 23-mm transcatheter heart valve. (c) The postdeployment CT image shows a circular but incompletely expanded transcatheter heart valve, owing to the significant oversizing of the valve based on the single two-dimensional measurement of an elliptical structure.
Figure 11
Figure 11
Images in a 63-year-old man with treated hypertension and hyperlipidemia presenting with diffuse chest pain and shortness of breath. Conventional angiography findings 2 years earlier had been normal. (a) ECG-gated CT angiogram displayed with curved planar reformation demonstrates extensive noncalcified plaque in the mid–left anterior descending coronary artery, causing severe stenosis (arrow). (b) Color-encoded mapping of regional myocardial wall motion obtained from 10 reconstructions across the cardiac cycle establishes the functional consequences of the coronary lesion with hypokinesis (purple) in the anterior and apical left ventricle (arrow). (c) The coronary lesion (arrow) was confirmed on a subsequent conventional angiogram.
Figure 12
Figure 12
Images in a 71-year-old man with CAD, status post three-vessel coronary artery bypass graft procedure and recurrent angina. (a) Pharmacologic stress, time-resolved myocardial CT perfusion maps superimposed on anatomic coronary CT angiography study demonstrates an occluded left internal mammary artery graft to the left anterior descending coronary artery (black arrow), with an associated stress-induced perfusion deficit in the anterior left ventricular myocardium (white open arrow). (b) Attenuation values within healthy (solid line) and diseased (dashed line) myocardium across the duration of the CT perfusion examination show persistently lower enhancement in the ischemic myocardium. (c) The perfusion deficit shown with CT correlates well with pharmacologic stress SPECT study in the same location (arrows).
Figure 13
Figure 13
Images in a 70-year-old woman with chest pain. (a) Coronary CT angiogram demonstrates a 50%–70% left anterior descending (LAD) coronary artery stenosis (arrows). (b) Coronary angiogram demonstrates the LAD stenosis (thin arrows), which was measured to be 58% at quantitative coronary angiography. FFR was measured to be 0.88 with a pressure sensor in the distal LAD during adenosine-induced hyperemia (thick arrow), indicating lack of functional (hemodynamic) significance. (c) Color encoding of computed FFRCT values mapped to volume-rendered CT angiogram shows the LAD stenosis (thin arrows). The FFRCT is 0.85 distal to the stenosis (thick arrow) at the site of the FFR measurement performed in b.

References

    1. Brooks B. Intra-arterial injection of sodium iodid: preliminary report. JAMA. 1924;82(13):1016–1019.
    1. Seldinger SI. Catheter replacement of the needle in percutaneous arteriography: a new technique. Acta Radiol. 1953;39(5 Suppl):368–376. - PubMed
    1. Dumoulin CL, Hart HR., Jr Magnetic resonance angiography in the head and neck. Acta Radiol Suppl. 1986;369:17–20. - PubMed
    1. Nishimura DG, Macovski A, Pauly JM. Magnetic resonance angiography. IEEE Trans Med Imaging. 1986;5(3):140–151. - PubMed
    1. Wing VW, Federle MP, Morris JA, Jr, Jeffrey RB, Bluth R. The clinical impact of CT for blunt abdominal trauma. AJR Am J Roentgenol. 1985;145(6):1191–1194. - PubMed

MeSH terms

LinkOut - more resources