. 2014 May 21;34(21):7203-15.
doi: 10.1523/JNEUROSCI.2791-13.2014.

A cerebellar learning model of vestibulo-ocular reflex adaptation in wild-type and mutant mice

Affiliations

A cerebellar learning model of vestibulo-ocular reflex adaptation in wild-type and mutant mice

Claudia Clopath et al. J Neurosci. .

Abstract

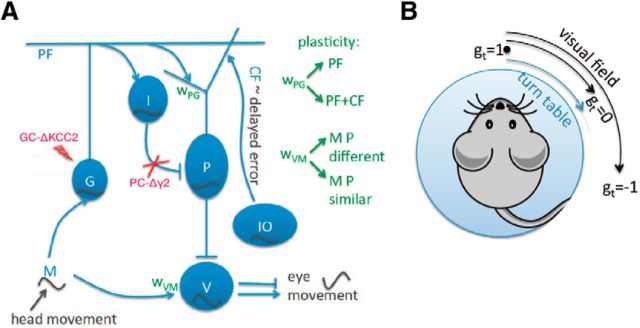
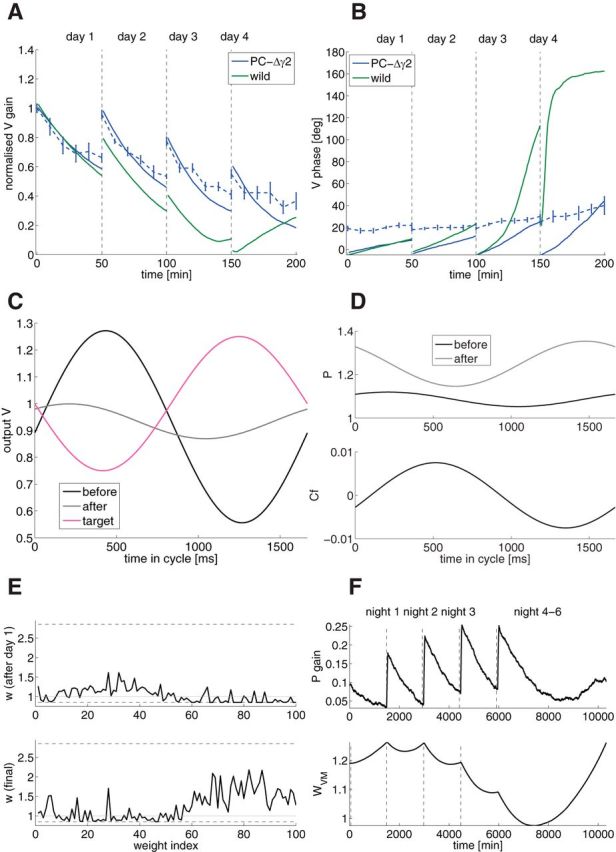
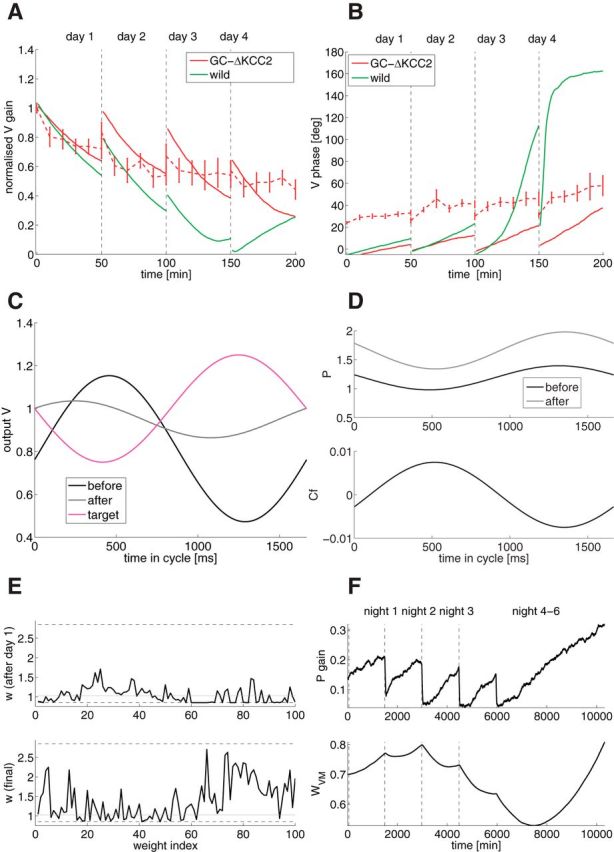
Mechanisms of cerebellar motor learning are still poorly understood. The standard Marr-Albus-Ito theory posits that learning involves plasticity at the parallel fiber to Purkinje cell synapses under control of the climbing fiber input, which provides an error signal as in classical supervised learning paradigms. However, a growing body of evidence challenges this theory, in that additional sites of plasticity appear to contribute to motor adaptation. Here, we consider phase-reversal training of the vestibulo-ocular reflex (VOR), a simple form of motor learning for which a large body of experimental data is available in wild-type and mutant mice, in which the excitability of granule cells or inhibition of Purkinje cells was affected in a cell-specific fashion. We present novel electrophysiological recordings of Purkinje cell activity measured in naive wild-type mice subjected to this VOR adaptation task. We then introduce a minimal model that consists of learning at the parallel fibers to Purkinje cells with the help of the climbing fibers. Although the minimal model reproduces the behavior of the wild-type animals and is analytically tractable, it fails at reproducing the behavior of mutant mice and the electrophysiology data. Therefore, we build a detailed model involving plasticity at the parallel fibers to Purkinje cells' synapse guided by climbing fibers, feedforward inhibition of Purkinje cells, and plasticity at the mossy fiber to vestibular nuclei neuron synapse. The detailed model reproduces both the behavioral and electrophysiological data of both the wild-type and mutant mice and allows for experimentally testable predictions.


Figures

Figure 1.
Figure 1.
A, VOR circuit. The MFs encode the head velocity. They project onto the GCs and to the MVN. The GCs project onto the PCs and onto the molecular INs, which in turn inhibit PCs. PCs receive excitatory inputs from CFs, which encode the error coming with a delay. Finally MVNs are inhibited by PCs and are responsible for the eye movement. In the model, we consider two plasticity sites: (1) the synaptic weights wPG from GCs to PCs at which depression is induced by costimulation of GCs and CFs, whereas stimulation of GCs alone produces potentiation and (2) synaptic weights wVM from MFs onto MVN where under MF and PC coactivation or co-inactivation depression is induced, whereas potentiation is due to sole activation of MF or PC. When the animal is placed on a turntable, MF is a cosine waveform since it encodes the head velocity. GCs, INS, and CFs are modulated in-phase with the head movement, whereas the PC is modulated in anti-phase. Since MVN is also modulated in-phase, and is mainly inhibitory, the eye movement is the inverse of the head movement, producing the VOR. In the case of the inhibitory knock-out mice, PC-Δγ2, PCs do not receive inhibition, and in the case of the GC mutant, GC-ΔKCC2, GC excitability is increased. B, VOR learning task. The mice are placed on a turntable. If the visual field is fixed, the target gain gt corresponds to 1. If the visual field turns with the table, gt = 0, and if the visual field turns twice the distance as the turn table, gt = −1, which corresponds to a phase-reversal learning.
Figure 2.
Figure 2.
Experimental results of the phase-reversal training. A, Gain as a function of training time (green, wild-type; blue, inhibitory knock-out PC-Δγ2, data redrawn from Wulff et al., 2009; red, GC mutant GC-ΔKCC2, data redrawn from Seja et al., 2012) of VORD (VOR in the dark; i.e., training is done in the light and eye measurement is done in the dark). The gain is relative to the initial gain. B, Phase as a function of training time of VORD. C, SS measurement during the VOR in the dark before training (black) and 3 d after training (gray). Outside the training periods the animals are kept in the dark. Left, SS peak-to-peak amplitude of the firing rate modulation. Middle, SS mean firing rate. Right, phase of the SS compared with the head movement velocity phase (*p < 0.05 t test). D, Same as C, except for the CSs.
Figure 3.
Figure 3.
Minimal model learning a phase-reversal scenario. A, Gain as a function of training time for the minimal model with four different delays in the CF, from 0 to 200 ms (different colors). The behavioral experimental data of Figure 2 is superimposed in dashed green. B, Phase as a function of training time. C, Gain before (dashed line) and after (solid line) the first day of training as a function of frequency for different delays in the CF (different colors). D, Phase before (dashed line) and after (solid) the second day of training as a function of frequency for different delays in the CF (different colors).
Figure 4.
Figure 4.
Detailed model for the wild-type mice learning the phase-reversal scenario. A, Gain as a function of training time (solid, model; dashed, experiments). B, Phase as a function of training time. C, Output V as a function of time in the cycle (black, initial value before learning; gray, final value after learning; magenta, target value). D, Top, PC SS activity P as a function of time in the cycle (black, initial value before learning; gray, after training). Bottom, CF as a function of time in the cycle in the dark. E, GC to PC weights as a function of weight index after the first day of training (top) and after the whole training (bottom). Dashed lines are the upper and lower bounds, the gray line is the initial weight. The weights are sorted by GC phase. F, Top, Gain evolution of PC as a signature of wPG plasticity across time. Bottom, wV M evolution across time.
Figure 5.
Figure 5.
Inhibitory knock-out model (model of PC-Δγ2 mice; Wulff et al., 2009), learning the phase-reversal scenario. A, Gain as a function of training time (blue, PC-Δγ2; solid, model; dashed, experiments; green, wild-type model). B, Phase as a function of training time. C, Output V of PC-Δγ2 as a function of time in the cycle (black, initial value before learning; gray, final value after learning; magenta, target value). D, Top, PC SS activity P of PC-Δγ2 as a function of time in the cycle (black, initial value before learning; gray, after training). Bottom, CF of PC-Δγ2 as a function of time in the cycle in the dark. E, GC to PC weights of PC-Δγ2 as a function of weight index after the first day of training (top) and after the whole training (bottom). Dashed lines are the upper and lower bounds, the gray line is the initial weight. The weights are sorted by GC phase. F, Top, Gain evolution of PC as a signature of wPG plasticity across time. Bottom, wV M evolution.
Figure 6.
Figure 6.
GC mutant model (model of GC-ΔKCC2 mice; Seja et al., 2012), learning the phase-reversal scenario. A, Gain as a function of training time (red, GC-ΔKCC2; solid, model; dashed, experiments; green, wild-type model). B, Phase as a function of training time. C, Output V of GC-ΔKCC2 as a function of time in the cycle (black, initial value before learning; gray, final value after learning; magenta, target value). D, Top, PC SS activity P of GC-ΔKCC2 as a function of time in the cycle (black, initial value before learning; gray, after training). Bottom, CF of GC-ΔKCC2 as a function of time in the cycle in the dark. E, GC to PC weights of GC-ΔKCC2 as a function of weight index after the first day of training (top) and after the whole training (bottom). Dashed lines are the upper and lower bounds; the gray line is the initial weight. The weights are sorted by GC phase. F, Top, Gain evolution of PC as a signature of wPG plasticity across time. Bottom, wV M evolution.

References

    1. Albus JS. A theory of cerebellar function. Math Biosci. 1971;10:25–61. doi: 10.1016/0025-5564(71)90051-4. - DOI
    1. Anzai M, Kitazawa H, Nagao S. Effects of reversible pharmacological shutdown of cerebellar flocculus on the memory of long-term horizontal vestibuloocular reflex adaptation in monkeys. Neurosci Res. 2010;68:191–198. doi: 10.1016/j.neures.2010.07.2038. - DOI - PubMed
    1. Arenz A, Silver RA, Schaefer AT, Margrie TW. The contribution of single synapses to sensory representation in vivo. Science. 2008;321:977–980. doi: 10.1126/science.1158391. - DOI - PMC - PubMed
    1. Badura A, Schonewille M, Voges K, Galliano E, Renier N, Gao Z, Witter L, Hoebeek FE, Chédotal A, De Zeeuw CI. Climbing fiber input shapes reciprocity of Purkinje cell firing. Neuron. 2013;78:700–713. doi: 10.1016/j.neuron.2013.03.018. - DOI - PubMed
    1. Barmack NH, Yakhnitsa V. Functions of interneurons in mouse cerebellum. J Neurosci. 2008;28:1140–1152. doi: 10.1523/JNEUROSCI.3942-07.2008. - DOI - PMC - PubMed

Publication types

MeSH terms

LinkOut - more resources