. 2014 May 21;34(21):7238-52.
doi: 10.1523/JNEUROSCI.5105-13.2014.

The role of intracellular linkers in gating and desensitization of human pentameric ligand-gated ion channels

Affiliations

The role of intracellular linkers in gating and desensitization of human pentameric ligand-gated ion channels

David Papke et al. J Neurosci. .

Abstract

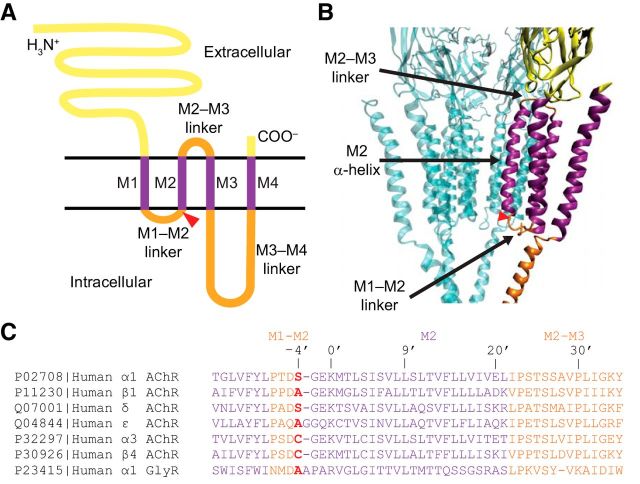
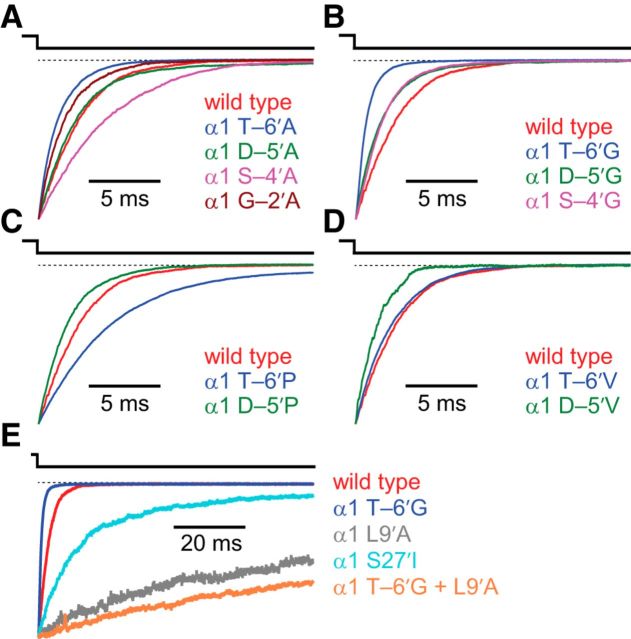
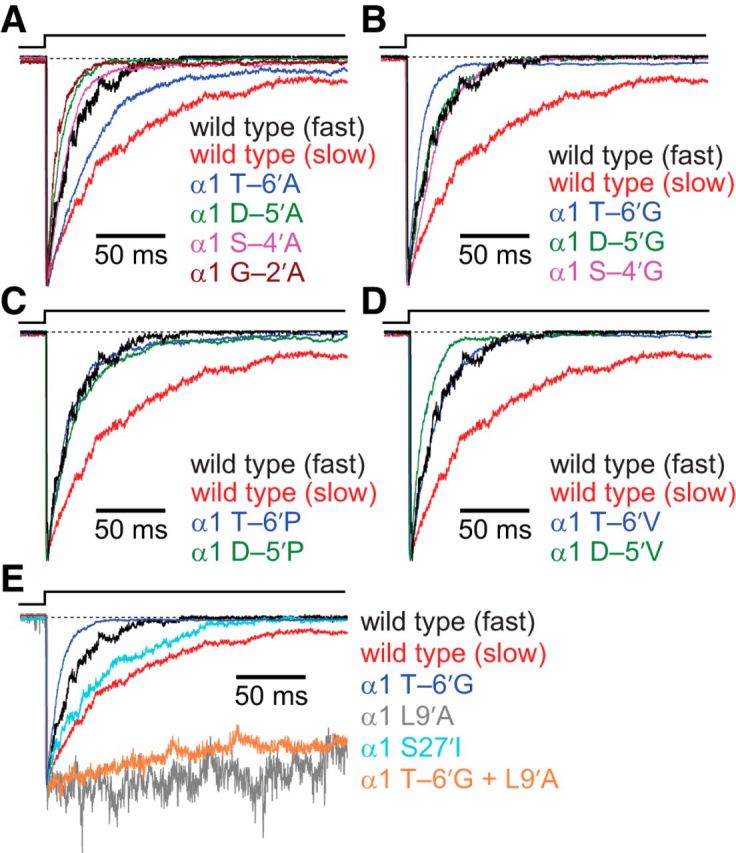
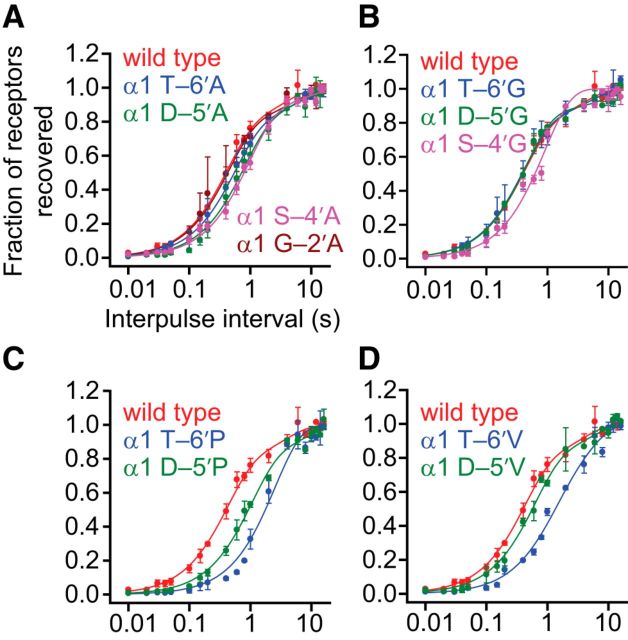
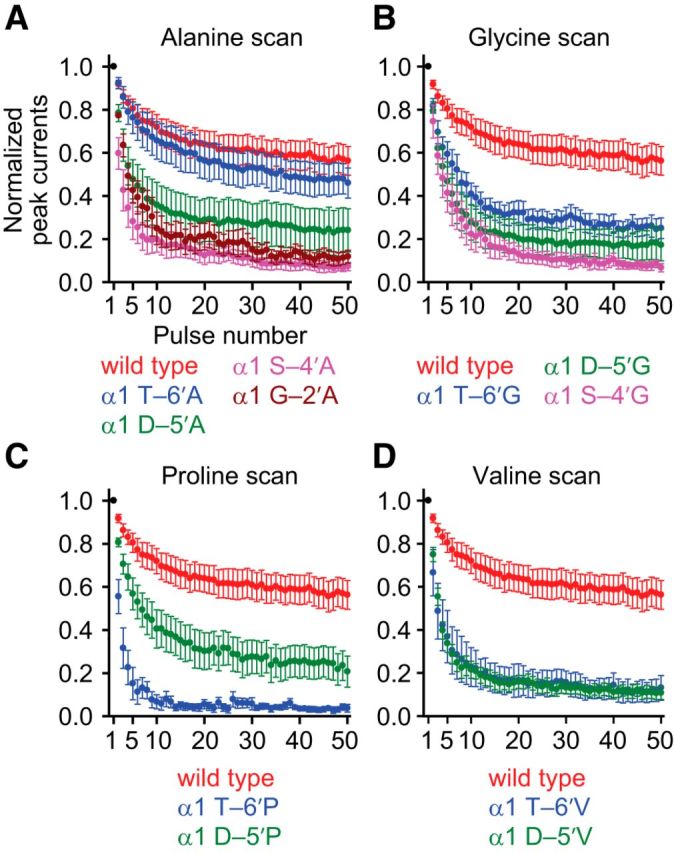
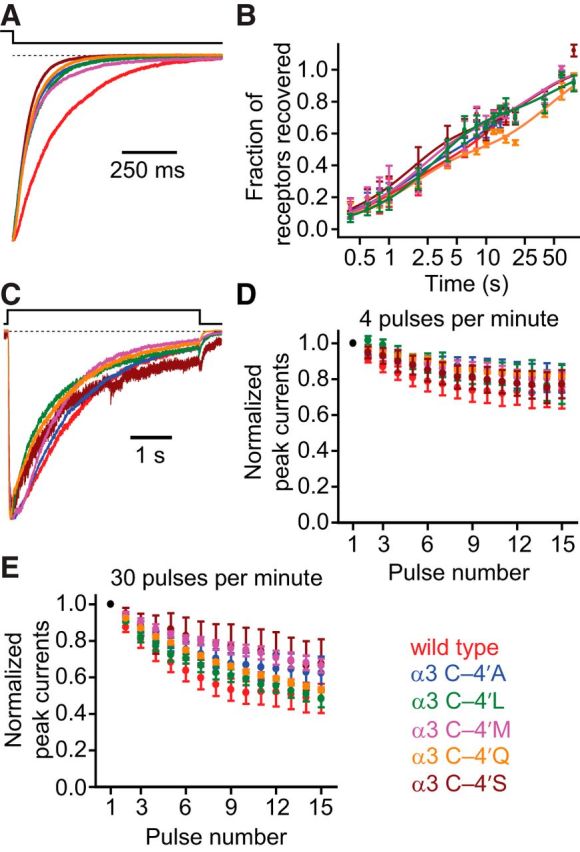
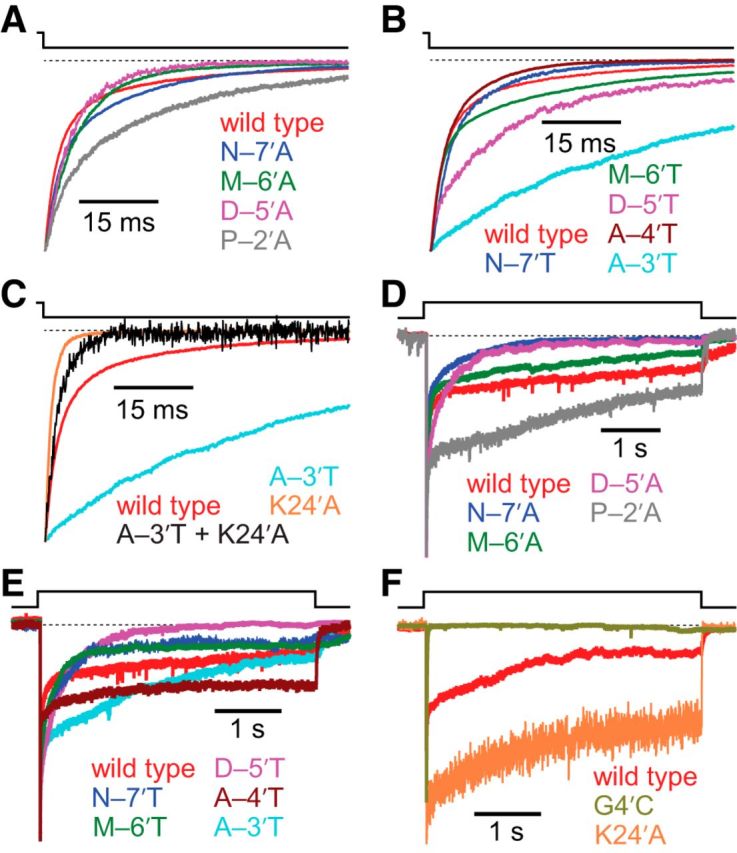
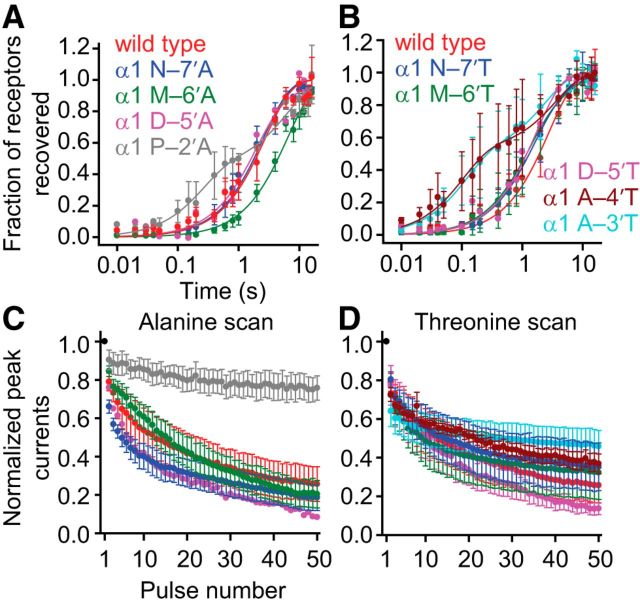
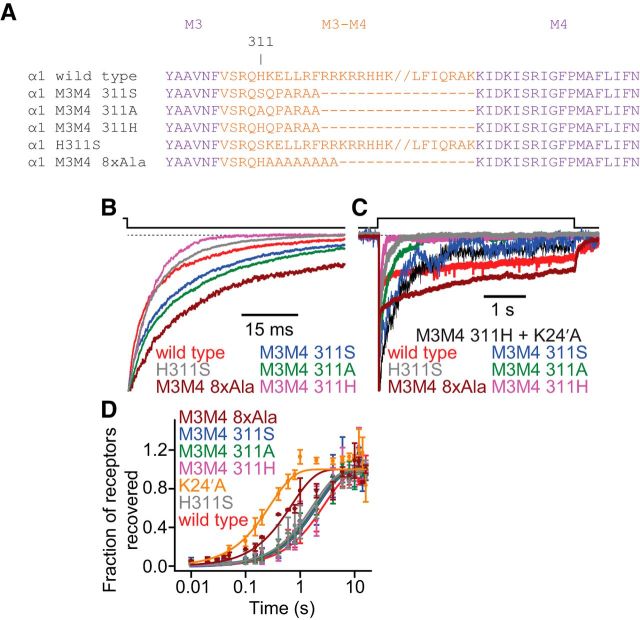
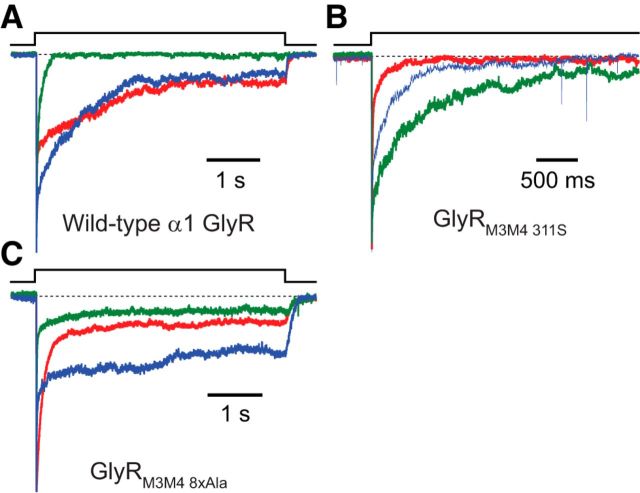
It has recently been proposed that post-translational modification of not only the M3-M4 linker but also the M1-M2 linker of pentameric ligand-gated ion channels modulates function in vivo. To estimate the involvement of the M1-M2 linker in gating and desensitization, we engineered a series of mutations to this linker of the human adult-muscle acetylcholine receptor (AChR), the α3β4 AChR and the homomeric α1 glycine receptor (GlyR). All tested M1-M2 linker mutations had little effect on the kinetics of deactivation or desensitization compared with the effects of mutations to the M2 α-helix or the extracellular M2-M3 linker. However, when the effects of mutations were assessed with 50 Hz trains of ∼1 ms pulses of saturating neurotransmitter, some mutations led to much more, and others to much less, peak-current depression than observed for the wild-type channels, suggesting that these mutations could affect the fidelity of fast synaptic transmission. Nevertheless, no mutation to this linker could mimic the irreversible loss of responsiveness reported to result from the oxidation of the M1-M2 linker cysteines of the α3 AChR subunit. We also replaced the M3-M4 linker of the α1 GlyR with much shorter peptides and found that none of these extensive changes affects channel deactivation strongly or reduces the marked variability in desensitization kinetics that characterizes the wild-type channel. However, we found that these large mutations to the M3-M4 linker can have pronounced effects on desensitization kinetics, supporting the notion that its post-translational modification could indeed modulate α1 GlyR behavior.

Keywords: fast perfusion; glycine receptors; ion-channel kinetics; nicotinic receptors; outside-out patches; patch-clamp.


Figures

Figure 1.
Figure 1.
The pore domain of pLGICs. A, Membrane-threading pattern of an individual subunit. Yellow represents the long N- and the short C-termini; purple represents the transmembrane α-helices; and orange represents the linkers between transmembrane α-helices. The M2 α-helix lines the pore and is flanked by the intracellular M1–M2 and the extracellular M2–M3 linkers. A red triangle represents the approximate location of the –4′ position. B, Diagram representation of the unliganded closed-channel conformation of the muscle-type AChR from Torpedo (PDB ID code 2BG9) (Unwin, 2005) rendered with VMD (Humphrey et al., 1996). For clarity, the β1 subunit is omitted. The different regions of one of the two α1 subunits are color-coded as in A. The approximate location of the –4′ position in the M1–M2 linker (red triangle) was inferred upon correction of a likely register error in the original structural model (Mnatsakanyan and Jansen, 2013). C, Sequence alignment of the wild-type subunits under study. The color code is the same as in A and B. Accession numbers are provided to the left of each sequence. A cysteine occurs at position –4′ of the human AChR subunits α2, α3, α4, α6, β2, and β4, and the human 5-HT3B subunit. Also, in the muscle AChR, a cysteine occupies position –4′ of the mouse (but not the human) δ subunit.
Figure 2.
Figure 2.
Effects of M1–M2 linker mutations on deactivation of the muscle AChR. Alanine (A), glycine (B), proline (C), and valine (D) scans were performed on the M1–M2 linker of the AChR α1 subunit, from position -7′ to position -2′ (Fig. 1). The concentration of ACh during the 1 ms ligand pulses was 1 mm, and the membrane potential was held constant at −80 mV. All recordings were performed using the outside-out configuration. The displayed (normalized) traces illustrate the average behavior of each construct (Table 1). E, Comparison of deactivation time courses of M1–M2 linker, M2 segment, and M2–M3 linker mutants. In all panels, a dashed line indicates the current baseline.
Figure 3.
Figure 3.
Effects of M1–M2 linker mutations on entry into desensitization of the muscle AChR. Alanine (A), glycine (B), proline (C), and valine (D) scans were performed on the M1–M2 linker of the AChR α1 subunit, as for Figure 2. The concentration of ACh during the 2 s ligand pulses was 1 mm, and the membrane potential was held constant at −80 mV. All recordings were performed using the outside-out configuration. In all panels, two traces exemplifying the fast-type (mono-exponential) and slow-type (double-exponential) time courses recorded from the wild-type channel are shown in black and red, respectively (see also Table 1). All other (normalized) traces illustrate the average behavior of each construct. Mutations to the M1–M2 linker tended to result in constructs with kinetics of entry into desensitization similar to those of the faster wild-type behavior. E, Comparison of entry into desensitization time courses of M1–M2 linker, M2 segment, and M2–M3 linker mutants. Recordings from constructs bearing the α1 L9′A mutation had small peak amplitudes, most likely because of low levels of channel expression in the patches of membrane that were successfully assayed; hence, upon normalization, these traces appear noisier. As was the case for deactivation, the α1 L9′A + T-6′G double mutant construct had a time course of entry into desensitization similar to that of the construct bearing the α1 L9′A mutation alone. In all panels, a dashed line represents the current baseline.
Figure 4.
Figure 4.
Effects of M1–M2 linker mutations on recovery from desensitization of the muscle AChR. Alanine (A), glycine (B), proline (C), and valine (D) scans were performed on the M1–M2 linker of the AChR α1 subunit, as for Figures 2 and 3. The concentration of ACh during the pairs of ligand pulses was 1 mm, and the membrane potential was held constant at −80 mV. All recordings were performed using the outside-out configuration. Axis labels are the same for all four panels. Pairs of pulses consisting of a 1 s “conditioning” pulse and a subsequent 100 ms “test” pulse, separated by intervals of variable duration, were applied to outside-out patches of membrane. Data points are the averages of values taken from several patches (between two and four). Error bars indicate the corresponding SE. For all mutants, the rate of recovery from desensitization is similar to that of the wild-type.
Figure 5.
Figure 5.
Effects of M1–M2 linker mutations on the response to repetitive stimulation of the muscle AChR. Alanine (A), glycine (B), proline (C), and valine (D) scans were performed on the M1–M2 linker of the AChR α1 subunit, as for Figures 2–4. The concentration of ACh during the 1 ms ligand pulses was 1 mm, and the membrane potential was held constant at −80 mV. All recordings were performed using the outside-out configuration. Axis labels are the same for all four panels. Data points are the average values (normalized to the peak-current response to the first pulse of ACh, in black) obtained from several patches (between 4 and 14). Error bars indicate the corresponding SE. For all four panels, the train responses exhibited peak-response depression consistent with the kinetics shown in Figures 2–4. Interestingly, some M1–M2 linker mutations have a large effect on the response to repetitive stimulation despite only having a relatively small effect on deactivation and desensitization.
Figure 6.
Figure 6.
Effects of mutations to the M1–M2 linker cysteine of the α3 AChR subunit on the behavior of α3β4 receptors. A, Deactivation time courses. B, Recovery from desensitization. C, Entry into desensitization. D, E, Responses to low-frequency trains of ACh pulses. The concentration of ACh during the ligand pulses was 1 mm, and the membrane potential was held constant at −80 mV. All recordings were performed using the whole-cell configuration; the solution-exchange time in this configuration was on the order of a few milliseconds, and hence, it was too long for higher-frequency trains of briefer ligand pulses to be applied reliably. Error bars indicate SE. A, C, Dashed line indicates the current baseline. D, E, Data points indicate the average values (normalized to the peak-current response to the first pulse of ACh; black) obtained from several patches (between 3 and 12). Error bars indicate corresponding SE. Overall, point mutations to the native cysteine at position –4′ of the α3 AChR subunit tended to have very little effect on channel kinetics, and they clearly failed to evoke the irreversible loss of responsiveness to ACh reported to result from the oxidation of the native side chain (Campanucci et al., 2008, 2010; Krishnaswamy and Cooper, 2012).
Figure 7.
Figure 7.
Effects of M1–M2 linker mutations on deactivation and entry into desensitization of the α1 GlyR. Alanine and threonine scans were performed on the M1–M2 linker of the α1 GlyR, from position –7′ to position –2′ (Fig. 1). The concentration of Gly during the ligand pulses was 10 mm, and the membrane potential was held constant at −80 mV. All recordings were performed using the outside-out configuration. Alanine-scan (A) and threonine-scan (B) time courses of deactivation. Most mutations to the M1–M2 linker had little to no effect on deactivation kinetics; the most notable exception was the A–3′T mutation, which slowed the deactivation time course down by a factor of 3.7 ± 0.4. C, Comparison of deactivation time courses of the A–3′T M1–M2 linker mutant and the K24′A M2–M3 linker mutant. Because the A–3′T + K24′A double mutant deactivated with a time course more similar to that of the K24′A single mutant than to that of the wild-type or the A–3′T single mutant, we infer that the loss-of-function K24′A mutation has a larger effect than the gain-of-function A–3′T mutation. Alanine-scan (D) and threonine-scan (E) time courses of entry into desensitization. The desensitization time courses of wild-type GlyRs are highly complex, typically requiring three exponential components (Table 3) to achieve a good fit; this complexity was observed for all studied M1–M2 mutant constructs, too. The time courses also exhibited considerable cell-to-cell variability, such that recordings from some cells required two or four exponential components, instead. Hence, although the data presented here exemplify the average behavior of the wild-type and mutant constructs, they do not capture the full range of responses observed. F, Desensitization time courses of wild-type, and M2 segment and M2–M3 linker mutants. A comparison with the time courses in D and E reveals that the G4′C M2 mutant desensitizes faster, and the K24′A M2–M3 linker mutant desensitizes more slowly, than any of the tested M1–M2 linker mutants. In all panels, a dashed line indicates the current baseline.
Figure 8.
Figure 8.
Effects of M1–M2 linker mutations on recovery from desensitization and high-frequency train responses of the α1 GlyR. Alanine and threonine scans were performed on the M1–M2 linker of the α1 GlyR, as for Figure 7. The concentration of Gly during the ligand pulses was 10 mm, and the membrane potential was held constant at −80 mV. All recordings were performed using the outside-out configuration. Alanine-scan (A) and threonine-scan (B) recovery from desensitization data. Axis labels are the same for both panels. Plots were generated in the same way as for Figure 4. Some of the mutations increased the number of exponential components required to obtain a good fit to the plotted data points. Alanine-scan (C) and threonine-scan (D) responses to high-frequency (50 Hz) trains of 1 ms pulses. Axis labels are the same for both panels, and the color code is the same as in A and B, respectively. Plots were generated in the same way as for Figure 5. Most M1–M2 linker mutants exhibited train responses similar to that of the wild-type. One exception was the P–2′A mutant, which exhibited very little peak-response depression even at a frequency as high as 50 Hz.
Figure 9.
Figure 9.
Effects of M3–M4 linker mutations on the kinetic properties of the α1 GlyR. A, Sequence alignment of the wild-type and M3–M4 linker mutant α1 GlyRs under study. The “//” in the wild-type α1 GlyR and H311S sequences indicates a break in the sequence meant only to increase the clarity of the alignment. B, Time courses of deactivation. Recordings from the GlyRM3M4 311H construct were most often best fit with a single exponential component, unlike recordings from all other constructs discussed here (Table 4); the representative trace decays to a zero-current level faster than those of all other constructs because it does not exhibit the slow component of decay. C, Time courses of entry into desensitization. Of all the tested constructs, the GlyRM3M4 311H desensitized the fastest. Addition of the K24′A mutation (which, when engineered on the wild-type background, slowed down desensitization to a large degree; Fig. 7F) to this construct slowed down desensitization as well, but the time course of the GlyRM3M4 311H + K24′A channel remained faster than that of the K24′A single-point mutant. Thus, we conclude that the large deletion of the M3–M4 linker engineered in the GlyRM3M4 311H construct has a comparatively large effect on entry into desensitization. The GlyRM3M4 8xAla construct, on the other hand, desensitized the slowest. D, Time courses of recovery from desensitization. Data were gathered and analyzed using the same methods as for Figure 4. Most constructs recovered at a rate similar to that of the wild-type α1 GlyR (Table 4). The data points corresponding to the GlyRM3M4 311S, GlyRM3M4 311A, and GlyRM3M4 311H constructs and H311S point mutant nearly “fall” on top of each other, making them difficult to distinguish. The GlyRM3M4 8xAla exhibited markedly faster recovery than the wild-type (Table 4). B, C, Dashed line indicates the current baseline. B–D, The concentration of Gly during the ligand pulses was 10 mm, and the membrane potential was held constant at −80 mV. All recordings were performed using the outside-out configuration.
Figure 10.
Figure 10.
Heterogeneity of α1 GlyR desensitization kinetics. A, Desensitization time courses recorded from three different patches of membrane containing the wild-type α1 GlyR. The traces in blue and green required two exponential components to achieve a good fit. However, the slower time constant of the exponential decay fitted to the trace in blue was an order of magnitude slower than that required to fit the time course in green. The time course in red required four exponential components to achieve a good fit. The differences between the displayed traces are indicative of the typical cell-to-cell variation observed with these receptors. In all cases, a fast-decaying component (4.92 ± 1.08 ms; Table 4) that would probably be missed in whole-cell recordings (even if a rapid, θ-tube-type perfusion of ligand were used) is present. B, Desensitization time courses recorded from three different patches of membrane containing the GlyRM3M4 311S construct. The trace in red required two exponential components to achieve a good fit, and the traces in green and blue required three. C, Desensitization time courses recorded from three different patches of membrane containing the GlyRM3M4 8xAla construct. The traces in green and red required three exponential components to achieve a good fit, whereas the trace in blue required four. For all three panels, the concentration of Gly during the ligand pulses was 10 mm, and the membrane potential was held constant at −80 mV. All recordings were performed using the outside-out configuration. In all panels, a dashed line indicates the current baseline. To allow for an easier visual comparison of the time courses across patches, all current traces were normalized to their peak values.
Figure 11.
Figure 11.
The fast component of entry into desensitization of the α1-GlyR. A, Current decay in the presence of ∼150 mm KCl in the pipette. The fast exponential component in this outside-out patch had a time constant of 3.67 ms and accounted for 62% of the total decay. Thus, even at this high concentration of intrapipette Cl, the fast component is a conspicuous feature of the decay time course. B, Two example traces of entry into desensitization recorded from two different outside-out patches. As was the case for all other α1-GlyR traces shown in this work (with the exception of the trace in A), the intrapipette Cl concentration was 42 mm. As indicated in the text, although the peak-current amplitude of the trace in red was larger, the relative amplitude of the faster exponential component in this trace was smaller than that of the trace in blue. It is unlikely, then, that the fast exponential component observed in A and B reflects a decrease in the intrapipette Cl concentration during the recording of Cl-carried inward currents. This notion is reinforced by the identification of a mutation in the M2–M3 linker that eliminates this fast component (Fig. 7F). The concentration of Gly during the ligand pulses was 10 mm, and the membrane potential was held constant at −80 mV. In both panels, a dashed line indicates the current baseline.

References

    1. Agopyan N, Tokutomi N, Akaike N. Protein kinase A-mediated phosphorylation reduces only the fast desensitizing glycine current in acutely dissociated ventromedial hypothalamic neurons. Neuroscience. 1993;56:605–615. doi: 10.1016/0306-4522(93)90360-R. - DOI - PubMed
    1. Amici SA, McKay SB, Wells GB, Robson JI, Nasir M, Ponath G, Anand R. A highly conserved cytoplasmic cysteine residue in the alpha4 nicotinic acetylcholine receptor is palmitoylated and regulates protein expression. J Biol Chem. 2012;287:23119–23127. doi: 10.1074/jbc.M111.328294. - DOI - PMC - PubMed
    1. Baptista-Hon DT, Deeb TZ, Lambert JJ, Peters JA, Hales TG. The minimum M3–M4 loop length of neurotransmitter-activated pentameric receptors is critical for the structural integrity of cytoplasmic portals. J Biol Chem. 2013;288:21558–21568. doi: 10.1074/jbc.M113.481689. - DOI - PMC - PubMed
    1. Blom N, Gammeltoft S, Brunak S. Sequence and structure-based prediction of eukaryotic protein phosphorylation sites. J Mol Biol. 1999;294:1351–1362. doi: 10.1006/jmbi.1999.3310. - DOI - PubMed
    1. Bocquet N, Nury H, Baaden M, Le Poupon C, Changeux JP, Delarue M, Corringer PJ. X-ray structure of a pentameric ligand-gated ion channel in an apparently open conformation. Nature. 2009;457:111–114. doi: 10.1038/nature07462. - DOI - PubMed

Publication types

MeSH terms

Associated data