. 2014 May 21;34(21):7266-80.
doi: 10.1523/JNEUROSCI.3973-13.2014.

Phosphorylation of synapsin I by cyclin-dependent kinase-5 sets the ratio between the resting and recycling pools of synaptic vesicles at hippocampal synapses

Affiliations

Phosphorylation of synapsin I by cyclin-dependent kinase-5 sets the ratio between the resting and recycling pools of synaptic vesicles at hippocampal synapses

Anne M J Verstegen et al. J Neurosci. .

Abstract

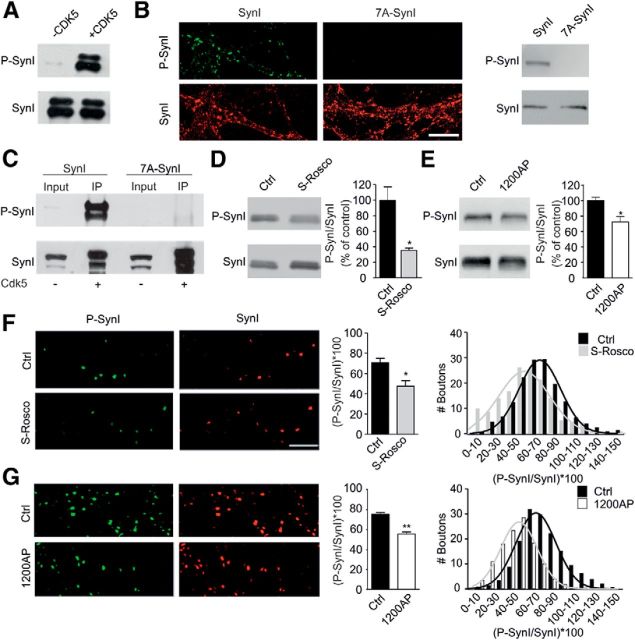
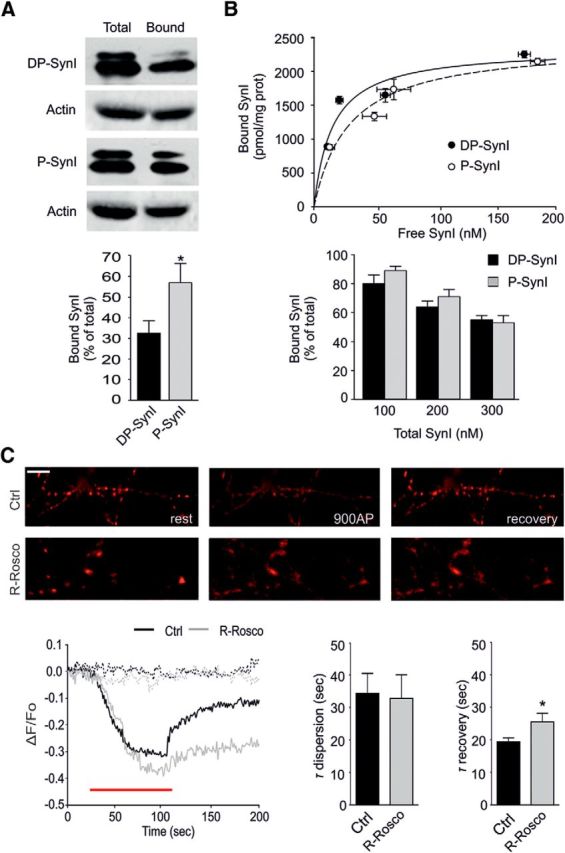
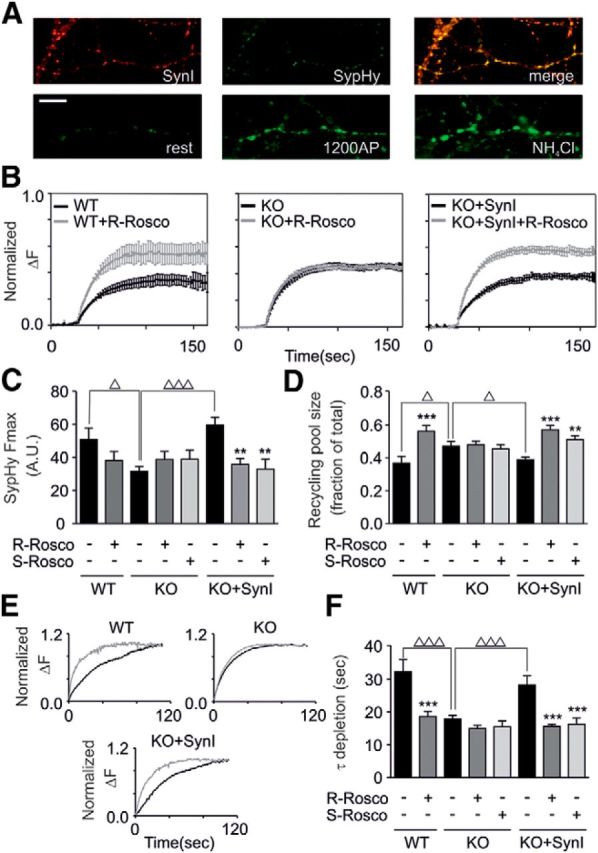
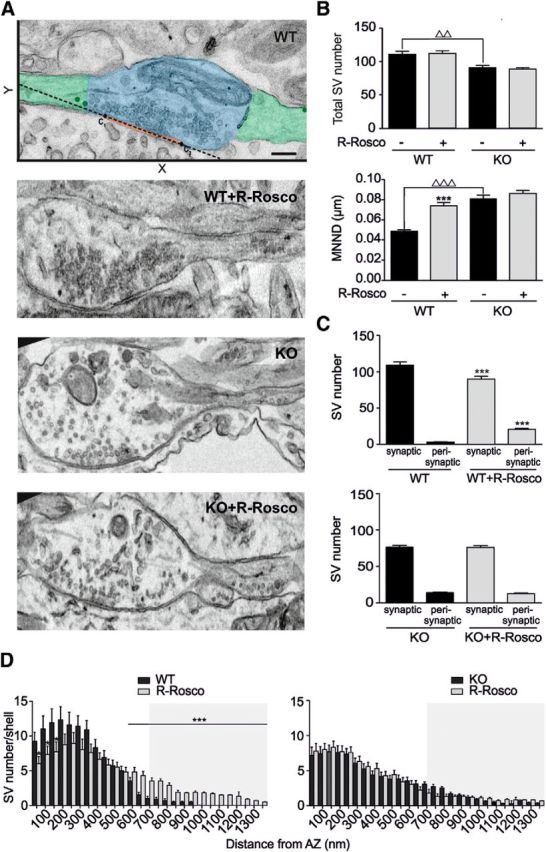
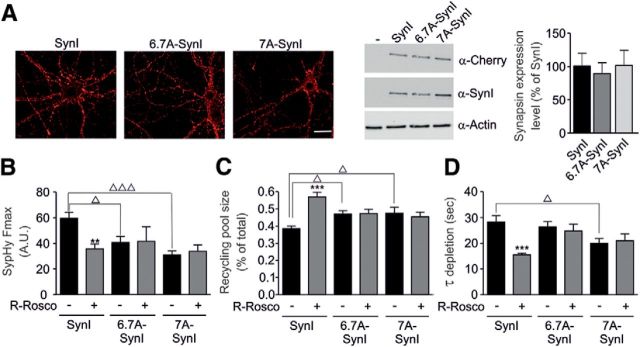
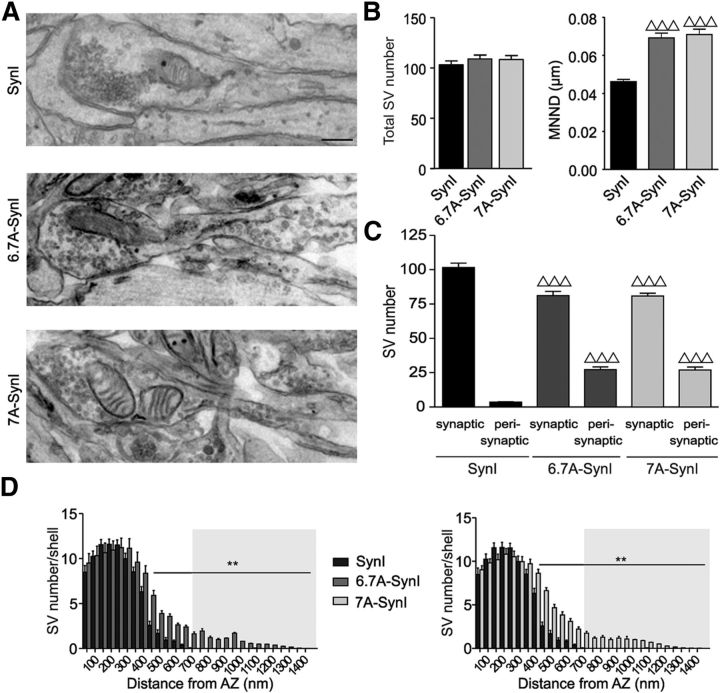
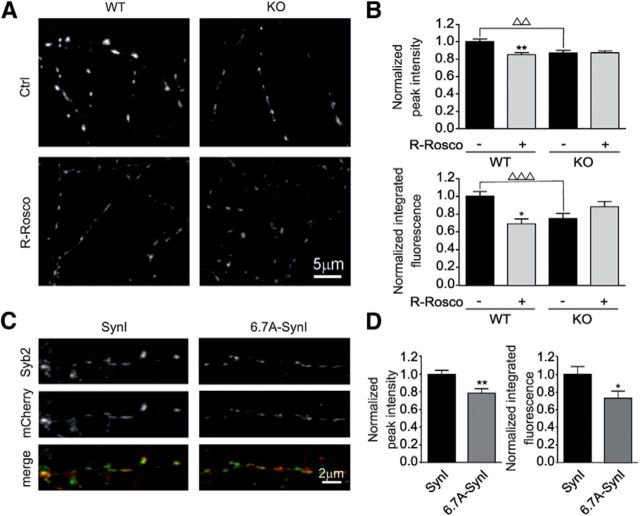
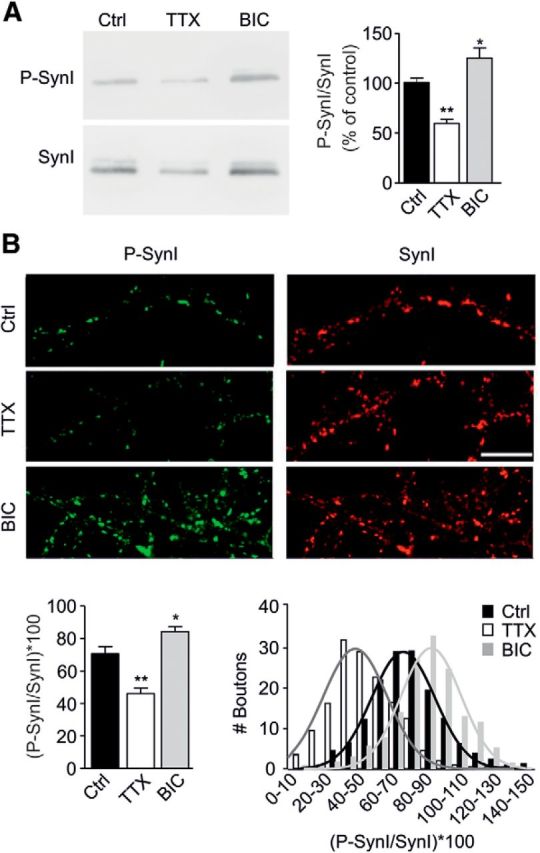
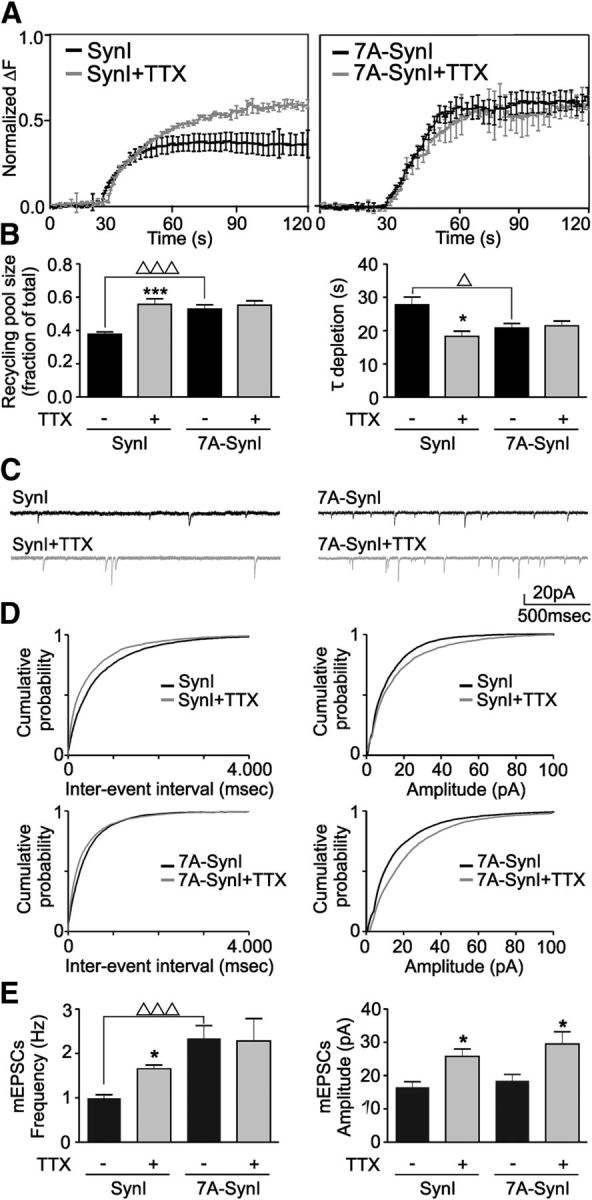
Cyclin-dependent kinase-5 (Cdk5) was reported to downscale neurotransmission by sequestering synaptic vesicles (SVs) in the release-reluctant resting pool, but the molecular targets mediating this activity remain unknown. Synapsin I (SynI), a major SV phosphoprotein involved in the regulation of SV trafficking and neurotransmitter release, is one of the presynaptic substrates of Cdk5, which phosphorylates it in its C-terminal region at Ser(549) (site 6) and Ser(551) (site 7). Here we demonstrate that Cdk5 phosphorylation of SynI fine tunes the recruitment of SVs to the active recycling pool and contributes to the Cdk5-mediated homeostatic responses. Phosphorylation of SynI by Cdk5 is physiologically regulated and enhances its binding to F-actin. The effects of Cdk5 inhibition on the size and depletion kinetics of the recycling pool, as well as on SV distribution within the nerve terminal, are virtually abolished in mouse SynI knock-out (KO) neurons or in KO neurons expressing the dephosphomimetic SynI mutants at sites 6,7 or site 7 only. The observation that the single site-7 mutant phenocopies the effects of the deletion of SynI identifies this site as the central switch in mediating the synaptic effects of Cdk5 and demonstrates that SynI is necessary and sufficient for achieving the effects of the kinase on SV trafficking. The phosphorylation state of SynI by Cdk5 at site 7 is regulated during chronic modification of neuronal activity and is an essential downstream effector for the Cdk5-mediated homeostatic scaling.

Keywords: Cdk5; actin; phosphorylation; synapsin; synaptic homeostasis; synaptic vesicle.


Conflict of interest statement

The authors declare no conflicts of interest.

Figures

Figure 1.
Figure 1.
Phosphorylation of SynI at site 7 by Cdk5 is constitutively high under basal conditions and is regulated by neuronal activity. A, Purified bovine SynI (1 μg) was incubated under phosphorylation conditions in the absence or presence of purified active Cdk5. Representative blot showing phospho-Ser551 (site 7; P-SynI) and total SynI immunoreactivities. B, Left column, Representative images of KO neurons transduced at 7 DIV with WT-SynI (SynI) or the Cdk5-dephosphomimetic mutant 7A-SynI and stained with the phospho-site 7 (P-SynI; green) and total (SynI; red) SynI antibodies. Scale bar, 10 μm. Right column, Phospho-SynI and total SynI immunoreactivities in lysates (15 μg protein/lane) of KO neurons transduced at 7 DIV with either WT-SynI (SynI) or the Cdk5-dephosphomimetic mutant 7A-SynI. C, GFP-tagged chimeras of either WT-SynI (SynI) or its phosphorylation mutant 7A-Syn I were overexpressed in COS-7 cells, purified by GFP immunoprecipitation (IP), phosphorylated “on bead” with purified active Cdk5, and assayed by immunoblotting with phospho-site 7-specific (P-Syn) and total SynI (SynI) antibodies. Input refers to the starting COS-7 cell lysates in which SynI is mostly dephosphorylated. The S551A mutation totally abolishes the in vitro site-7 phosphorylation by Cdk5. The experiments shown in A–C reveal the specificity of the phospho-Syn antibody toward the phosphorylated SynI site 7. D, Phospho-SynI and total SynI immunoreactivities in lysates (15 μg protein/lane) of WT hippocampal neurons (14 DIV) in the absence (Ctrl) or presence of S-Rosco (100 μm) for 30 min before harvesting. E, Phospho-SynI and total SynI immunoreactivities in lysates (15 μg protein/lane) of WT primary hippocampal neurons (14 DIV) incubated under resting conditions (Ctrl) or electrically stimulated with 1200 APs at 10 Hz before harvesting. Shown in D and E are representative blots (left) and the respective changes in the phospho-SynI/SynI ratio (right; means ± SEMs) evaluated by densitometric scanning of blots from three to four independent experiments. F, G, Left columns, Representative images of WT hippocampal neurons stained with phospho-Syn (green) and total SynI (red) antibodies under control conditions (Ctrl), after 30 min incubation with S-Rosco (100 μm; F), or after 1200 APs at 10 Hz (1200AP; G). Scale bar, 10 μm. Right columns, Mean values (left) and frequency distribution (right) of the phospho-SynI/SynI ratio in control (black bars), S-Rosco-treated (gray bars), and electrically stimulated (white bars) terminals. Data are means ± SEMs of three to four independent experiments (n = 150 terminals per experimental group per experiment). *p < 0.05, **p < 0.01, paired Student's t test. Superimposed on the frequency distribution histograms are Gaussian fits showing the shift of the phospho-SynI/SynI intensity ratio during treatments. Distributions were analyzed using the Kolgomorov–Smirnov test (p < 0.05, S-Rosco vs Ctrl).
Figure 2.
Figure 2.
Cdk5 phosphorylation enhances SynI binding to actin filaments. A, Top, Representative immunoblot of a SynI–actin binding experiment. Purified bovine SynI (500 nm) was phosphorylated by Cdk5 in vitro as shown in Figure 1A. Dephosphorylated (DP-SynI) or Cdk-phosphorylated (P-SynI) SynI was subsequently incubated with polymerized actin (5 μm) for 30 min and subjected to high-speed centrifugation. The immunoblots show total SynI and F-actin and their recovery in the pellet (bound). Bottom, The amounts of dephosphorylated (DP-SynI; black bars) or Cdk5-phosphorylated (P-SynI; gray bars) SynI bound to F-actin are reported in percentage of total SynI. Data are expressed as means ± SEMs of six independent experiments. *p < 0.05, Student's t test. Cdk5 phosphorylation of SynI significantly increased its binding to actin filaments. B, Top, Binding isotherms of dephosphorylated (DP-SynI; black symbols) and Cdk5-phosphorylated (P-SynI; white symbols) SynI to highly purified SVs that were quantitatively depleted of endogenous Syns. The mean ± SEM bound SynI values (picomoles per milligram of protein) were plotted against the respective mean ± SEM free SynI concentration (nanomolar) and fitted as described in Materials and Methods. No significant changes in either the Bmax or KD values were observed. Bottom, The binding of dephosphorylated (DP-SynI; black bars) and Cdk5-phosphorylated (P-SynI; gray bars) SynI to SVs is plotted as a percentage of the total SynI at the indicated total SynI concentrations. Data are means ± SEMs of six independent experiments. Cdk5 phosphorylation did not significantly affect the binding of SynI to SVs. C, Top row, Representative images showing punctate staining for mCherry–SynI transduced in KO hippocampal neurons at 7 DIV and analyzed at 14 DIV under resting conditions (rest), during (900AP), or after (recovery) field stimulation with 900 APs at 10 Hz. Scale bar, 5 μm. Bottom row, Representative time courses (left) of fluorescence changes in synapses before, during, and after field stimulation (red horizontal bar) in primary neurons expressing mCherry–SynI in the absence (black) or presence (gray) of R-Rosco. Dotted lines represent bleaching in the absence (black) or presence (gray) of R-Rosco. Rates of SynI dispersion during stimulation (middle) and reclustering after stimulation (right) in the absence (Ctrl, black bar) or presence (gray bar) of R-Rosco are shown as means ± SEMs of 13 and 12 coverslips, respectively. *p < 0.05, Student's t test. Cdk5 inhibition was ineffective in regulating the kinetics of activity-dependent SynI dispersion but significantly impaired the recovery phase.
Figure 3.
Figure 3.
Cdk5 inhibition is ineffective in regulating the RP/RestP ratio in SynI KO neurons. A, Top row, Representative images of SynI/SypHy cotransduced KO neurons analyzed at 14 DIV (7 d after transduction). SynI (red) and SypHy (green) displayed almost complete colocalization as shown in the merge panel. Bottom row, Representative images of SypHy fluorescence of an axon at rest, at the peak response to 1200 APs at 10 Hz (1200AP), and after the application of 50 mm NH4Cl. Scale bar, 5 μm. B, SypHy fluorescence traces plotted for WT (left), KO (middle), and KO + SynI (right) neurons stimulated with 1200 APs at 10 Hz in 1 μm bafilomycin in the presence (gray traces) or absence (black traces) of R-Rosco (100 μm). Traces show the mean ± SEM of the change in ΔF values (FF0) normalized by the respective Fmax and represent the RP as a fraction of the total SV pool. Data are from 8 and 10 coverslips for WT cells, 13 and 8 coverslips for KO cells, and 12 and 10 coverslips for KO + SynI cells, in the absence or presence of R-Rosco, respectively. C, Evaluation of total dequenched fluorescence levels (Fmax; arbitrary units) of SypHy transduced in WT neurons (WT), SynI KO neurons (KO), or SynI KO neurons cotransduced with WT-SynI (KO + SynI) in the absence or presence of either R-Rosco or S-Rosco. Data (means ± SEMs) are from the same experiments shown in B plus additional nine coverslips for KO cells and nine for KO + SynI cells in the presence of S-Rosco. SynI KO neurons display a substantially reduced Fmax compared with WT neurons. Fmax in KO neurons is fully rescued by the expression of WT-SynI. Cdk5 blockade induces a reduction of Fmax in WT neurons and in KO + SynI but not in KO neurons. D, Mean ± SEM of the RP fraction of the total SV pool calculated from the exponential fit of the individual plateau values of RP depletion in the absence or presence of either R-Rosco or S-Rosco. E, The ensemble traces reported in B were normalized to the respective plateau values to visualize the kinetics of RP depletion. F, The rising phase of the individual fluorescence traces were fitted using a monoexponential function, yielding individual time constants (τ) whose mean ± SEM values are shown in the plot. Statistical analysis was performed using one-way ANOVA, followed by the Bonferroni's multiple comparison test. **p < 0.01, ***p < 0.001 versus the respective untreated control. Δp < 0.05; ΔΔΔp < 0.001 across genotype.
Figure 4.
Figure 4.
Cdk5 inhibition alters SV density and distribution in WT, but not in SynI KO, synapses. A, Representative electron micrographs of WT and KO hippocampal synapses (14 DIV) either untreated or treated with R-Rosco (100 μm) for 30 min. In the WT panel, a schematic representation of the morphometric procedure followed to calculate SV distribution at synapses is shown. After identification of the AZ (orange line) and tracing of the line passing through the start (C1) and the end (C2) points of AZ (dotted line), the distance of individual SVs from the AZ was calculated in the Cartesian plane. The synaptic zone (blue area) was defined as the presynaptic area between 0 and 700 nm distance from the center of the AZ segment, whereas the perisynaptic zone (green areas) was defined as the presynaptic area between 700 and 1400 nm from the AZ segment. Green spheres represent perisynaptic SVs (for additional details, see Materials and Methods). Scale bar, 200 nm. B, Morphometric analysis of the total SV number (distance from the center of the AZ < 1400 nm; top) and extent of clustering (MNND; bottom) in WT and KO synapses treated as described in A. No changes in the terminal area and the AZ length were observed across experimental groups. Statistical analysis was performed using one-way ANOVA, followed by the Bonferroni's multiple comparison test. ***p < 0.001 versus the respective untreated control. ΔΔp < 0.005, ΔΔΔp < 0.001 across genotype. C, Morphometric analysis of the SV number in synaptic (SV distance from AZ < 700 nm) and perisynaptic (700 nm < SV distance from AZ < 1400 nm) areas in WT (top) and KO (bottom) synapses treated as described in A. No changes in the synaptic and perisynaptic areas were observed across experimental groups. Statistical analysis was performed using one-way ANOVA, followed by the Bonferroni's multiple comparison test. ***p < 0.001 versus the respective untreated control. D, Distribution of SVs in WT (left) and KO (right) nerve terminals incubated for 30 min in the absence (black bars) or presence (gray bars) of R-Rosco (100 μm). The absolute number of SVs located within successive 50 nm shells from the AZ is shown. The frequency distribution of SVs as a function of the distance from the AZ was analyzed by using the Kolgomorov–Smirnov test. R-Rosco treatment significantly altered the SV distribution in WT (p = 0.001), but not in KO, synapses. The effects of R-Rosco within the respective genotype were compared by using the Student's t test within shells (*p < 0.05, ***p < 0.005). Gray squares represent perisynaptic SVs as evaluated in C. Data are means ± SEMs of 58 (WT), 60 (WT+R-Rosco), 67 (KO), and 71 (KO+R-Rosco) synapses from four independent preparations.
Figure 5.
Figure 5.
Phosphorylation of SynI is necessary and sufficient for the effects of Cdk5 on the SV RP size and depletion kinetics. A, Left panels, Representative images of 14 DIV KO neurons transduced at 7 DIV with either WT-SynI (SynI) or the Cdk5-dephosphomimetic mutants 6,7A-SynI and 7A-SynI. Scale bar, 10 μm. Middle panel, Representative immunoblot with anti-Cherry (α-Cherry) and anti-SynI (α-SynI) antibodies shows comparable expression levels of WT-SynI, 6,7A-SynI, and 7A-SynI in lysates of transduced KO primary hippocampal neurons. Actin immunoreactivity (α-Actin) was used as a loading control. Right panel, Expression levels of transduced SynI variants in SypHy-positive ROIs corresponding to active synaptic boutons, as evaluated from the fluorescence intensity of the mCherry signal. WT and mutant exogenous SynI are similarly expressed and correctly targeted to nerve terminals in SynI KO neurons. B, Total dequenched fluorescence levels (Fmax; arbitrary units) of SypHy in SynI KO neurons cotransduced with WT-SynI (SynI), 6,7A-SynI (6,7A-SynI), or 7A-SynI (7A-SynI) in the absence or presence of either R-Rosco or S-Rosco. Data (means ± SEMs) are from 12 and 10 KO + SynI coverslips, 16 and 10 KO + 6,7A-SynI coverslips, and 12 and 7 KO + 7A-SynI coverslips in the absence or presence of R-Rosco, respectively. Both 6,7A-SynI and 7A-SynI neurons exhibited lower Fmax values compared with WT-SynI transduced neurons. Cdk5 blockade induced a reduction of Fmax in KO + SynI, whereas it was ineffective in KO + 6,7A-SynI and KO + 7A-SynI neurons. C, Mean ± SEM of RP over the total SV pool in the absence or presence of R-Rosco. D, Mean ± SEM time constants (τ) of RP depletion obtained from monoexponential fitting of individual curves in the absence or presence of R-Rosco. Statistical analysis was performed by using one-way ANOVA, followed by the Bonferroni's multiple comparison test. **p < 0.01, ***p < 0.001 versus the respective untreated control. Δp < 0.05, ΔΔΔp < 0.005 across SynI variants.
Figure 6.
Figure 6.
Mutation of Cdk5 phosphorylation sites of SynI mimics the effects of Cdk5 inhibition on SV density and distribution. A, Representative electron micrographs of KO neurons (14 DIV) transduced at 7 DIV with WT-SynI (SynI), 6,7A-SynI, or 7A-SynI. Scale bar, 200 nm. B, Morphometric analysis of the total SV number (left) and MNND (right) in KO synapses of neurons transduced as described in A. No changes in the terminal area or the AZ length were observed across experimental groups. Data are means ± SEMs of 100 (SynI, black bars), 93 (6,7A-SynI, dark gray bars), and 119 (7A-SynI, light gray bars) KO synapses from two independent preparations. Data were analyzed by one-way ANOVA, followed by the Dunnett's multiple comparison test. ΔΔΔp < 0.001 versus SynI. C, Morphometric analysis of the SV number in synaptic and perisynaptic areas in the KO neurons described in B. No changes in the synaptic and perisynaptic areas were observed across experimental groups. Data are analyzed by one-way ANOVA, followed by the Dunnett's multiple comparison test. ΔΔΔp < 0.001 versus SynI. D, Distribution of SVs in KO + SynI and KO + 6,7A-SynI (left) or KO + 7A-SynI (right) nerve terminals. The absolute number of SVs (means ± SEMs) located within successive 50 nm shells from the AZ is shown. Gray squares represent perisynaptic SVs as evaluated in C. The frequency distribution of SVs as a function of the distance from the AZ was analyzed by the Kolgomorov–Smirnov test. Either SynI mutant significantly right shifted the SV distribution with respect to WT-SynI (p = 0.0027, 6,7A-SynI vs SynI; p = 0.003, 7A-SynI vs SynI). Within shells, the effect of either mutant was compared with that of WT-SynI by using the Student's t test (**p < 0.01).
Figure 7.
Figure 7.
Quantitative immunofluorescence analysis with the endogenous SV marker Syb2. A, Immunostaining for Syb2 in WT and KO neurons that were treated with either vehicle (Ctrl) or R-Rosco (100 μm) for 30 min. The Syb2 fluorescence intensity at synaptic boutons is lower in both untreated KO neurons and WT neurons treated with R-Rosco with respect to untreated WT neurons, confirming SV dispersion. Scale bar, 5 μm. B, Normalized peak fluorescence intensity and integrated fluorescence at synaptic puncta of WT and KO neurons incubated in the absence or presence of R-Rosco. Notice that, in untreated KO neurons and in both WT and KO neurons treated with R-Rosco, the fluorescence is less concentrated at synaptic boutons. Data are means ± SEMs of 42 (WT), 45 (WT + R-Rosco), 42 (KO), and 41 (KO + R-Rosco) images from three independent preparations. Statistical analysis was performed using two-way ANOVA, followed by the Bonferroni's multiple comparison test. *p < 0.05, **p < 0.01 versus the respective untreated control. ΔΔp < 0.01, ΔΔΔp < 0.001 across genotype. C, Immunostaining for Syb2 in KO neurons that were transduced with mCherry chimeras of either WT-SynI (left) or 6,7A-SynI mutant (right). The bottom row displays the merge of the green (Syb2) and red (mCherry) channels showing that the two proteins colocalize at synaptic boutons. The Syb2 fluorescence intensity at synaptic boutons is lower in KO neurons transduced with 6,7A-SynI with respect to WT-SynI. Scale bar, 2 μm. D, Normalized peak fluorescence intensity and integrated fluorescence at synaptic puncta of neurons transduced with WT-SynI (SynI) or 6,7A-SynI. Expression of the dephosphomimetic mutant decreases Syb2 fluorescence at synaptic boutons. Data are means ± SEMs of 15 (WT-SynI) and 12 (6,7A-SynI) images from three independent preparations. Statistical analysis was performed using the Student's t test. *p < 0.05, **p < 0.01.
Figure 8.
Figure 8.
SynI phosphorylation at site 7 by Cdk5 in mature hippocampal synapses is regulated by homeostatic synaptic scaling. A, Left, Representative blot showing Ser551 phosphorylated (P-SynI) and total (SynI) SynI immunoreactivity in lysates from primary WT neuronal cultures that were left untreated (Ctrl) or treated with either TTX (1 μm) or BIC (30 μm) for 72 h. Right, Phospho-SynI/SynI ratios calculated by densitometric scanning of the blots. Data are means ± SEMs of three independent experiments run in duplicate. *p < 0.05, **p < 0.01, one-way ANOVA, followed by Dunnett's multiple comparison test. B, Top panels, Representative images of hippocampal synapses labeled with phospho-Syn (green) and total SynI (red) antibodies under control conditions (Ctrl) or after incubation with either TTX or BIC for 72 h. Scale bar, 10 μm. Bottom panels, Mean values (left) and frequency distribution (right) of the phospho-SynI/SynI ratio in terminals of control (black bars; same data from Fig. 1F), TTX-treated (white bars), or BIC-treated (gray bars) neurons. Data are means ± SEMs of four independent experiments (n = 150 terminals per experimental group per experiment). Chronic TTX treatment significantly decreased the extent of Cdk5 phosphorylation of SynI and induced a left shift in the distribution profile of the phospho-SynI/SynI ratio compared with untreated terminals. In contrast, chronic BIC treatment significantly increased the degree of SynI phosphorylation by Cdk5 and caused a right shift in the distribution profile. *p < 0.05, **p < 0.01, one-way ANOVA, followed by Dunnett's multiple comparison test. Frequency distributions were analyzed using the Kolgomorov–Smirnov test (p = 0.011, TTX vs control; p = 0.003, BIC vs control).
Figure 9.
Figure 9.
Mutation of phosphorylation site 7 in SynI mimics and occludes the effects of chronic silencing of neural activity on SV trafficking and mEPSC frequency. A, Ensemble average traces of SypHy fluorescence plotted in KO synapses transduced with either WT-SynI (SynI; left) or 7A-SynI (right). Neurons, incubated for 72 h in the absence (black traces) or presence (gray traces) of 1 μm TTX, were stimulated with 1200 APs at 10 Hz in 1 μm bafilomycin. Solid traces show the average ± SEM time course of the changes in ΔF values (FF0) normalized by the respective Fmax and represent the RP as a fraction of the total SV pool. Data are from seven, four, six, and seven coverslips for WT-SynI, WT-SynI + TTX, SynI-7A, and SynI-7A + TTX groups, respectively. B, The mean ± SEM fraction of the RP fraction of the total SV pool, calculated from the individual plateau values (left), and the means ± SEMs of the individual time constants (τ) of RP depletion, calculated from the monoexponential fitting of the individual fluorescence traces (right), are shown for WT-SynI- or 7A-SynI-expressing neurons incubated for 72 h in the absence (black columns) or presence (gray columns) of TTX. Statistical analysis was performed using one-way ANOVA, followed by the Bonferroni's multiple comparison test. *p < 0.05, ***p < 0.001 versus the respective untreated control. Δp < 0.05, ΔΔΔp < 0.001 across genotype. C, mEPSCs were recorded in KO synapses transduced with either WT-SynI (SynI; left) or 7A-SynI (right) incubated for 72 h in the absence (black traces) or presence (gray traces) of 1 μm TTX. D, Cumulative probability of the interevent intervals (left) and amplitude (right) of mEPSCs recorded in KO synapses transduced with either WT-SynI (top) or 7A-SynI (bottom) and incubated in the presence (gray line) or absence (black line) of TTX. E, The frequency (left) and amplitude (right) of mEPSCs in transduced synapses are reported as means ± SEMs for the four experimental groups described above. Cumulative curves and mean values were obtained from 3 min recordings from n = 15, 13, 12, and 12 neurons for WT-SynI, WT-SynI + TTX, SynI-7A, and SynI-7A + TTX groups, respectively. Statistical analysis was performed using two-way ANOVA, followed by the Bonferroni's multiple comparison test. *p < 0.05 versus respective untreated control. ΔΔΔp < 0.001 across genotype.

References

    1. Alabi AA, Tsien RW. Synaptic vesicle pools and dynamics. Cold Spring Harb Persp Biol. 2012;4:a013680. doi: 10.1101/cshperspect.a013680. - DOI - PMC - PubMed
    1. Amin ND, Zheng YL, Kesavapany S, Kanungo J, Guszczynski T, Sihag RK, Rudrabhatla P, Albers W, Grant P, Pant HC. Cyclin-dependent kinase 5 phosphorylation of human septin SEPT5 (hCDCrel-1) modulates exocytosis. J Neurosci. 2008;28:3631–3643. doi: 10.1523/JNEUROSCI.0453-08.2008. - DOI - PMC - PubMed
    1. Bähler M, Greengard P. Synapsin I bundles F-actin in a phosphorylation-dependent manner. Nature. 1987;326:704–707. doi: 10.1038/326704a0. - DOI - PubMed
    1. Baldelli P, Fassio A, Valtorta F, Benfenati F. Lack of synapsin I reduces the readily releasable pool of synaptic vesicles at central inhibitory synapses. J Neurosci. 2007;27:13520–13531. doi: 10.1523/JNEUROSCI.3151-07.2007. - DOI - PMC - PubMed
    1. Barnett DG, Bibb JA. The role of Cdk5 in cognition and neuropsychiatric and neurological pathology. Brain Res Bull. 2011;85:9–13. doi: 10.1016/j.brainresbull.2010.11.016. - DOI - PMC - PubMed

Publication types

MeSH terms