. 2014 May 21;9(5):e97622.
doi: 10.1371/journal.pone.0097622. eCollection 2014.

Olive phenolics as c-Met inhibitors: (-)-Oleocanthal attenuates cell proliferation, invasiveness, and tumor growth in breast cancer models

Affiliations

Olive phenolics as c-Met inhibitors: (-)-Oleocanthal attenuates cell proliferation, invasiveness, and tumor growth in breast cancer models

Mohamed R Akl et al. PLoS One. .

Abstract

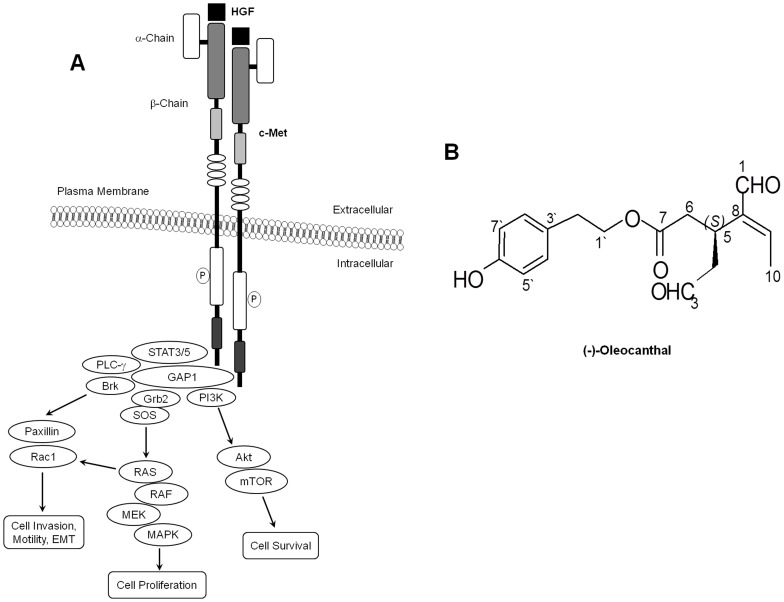
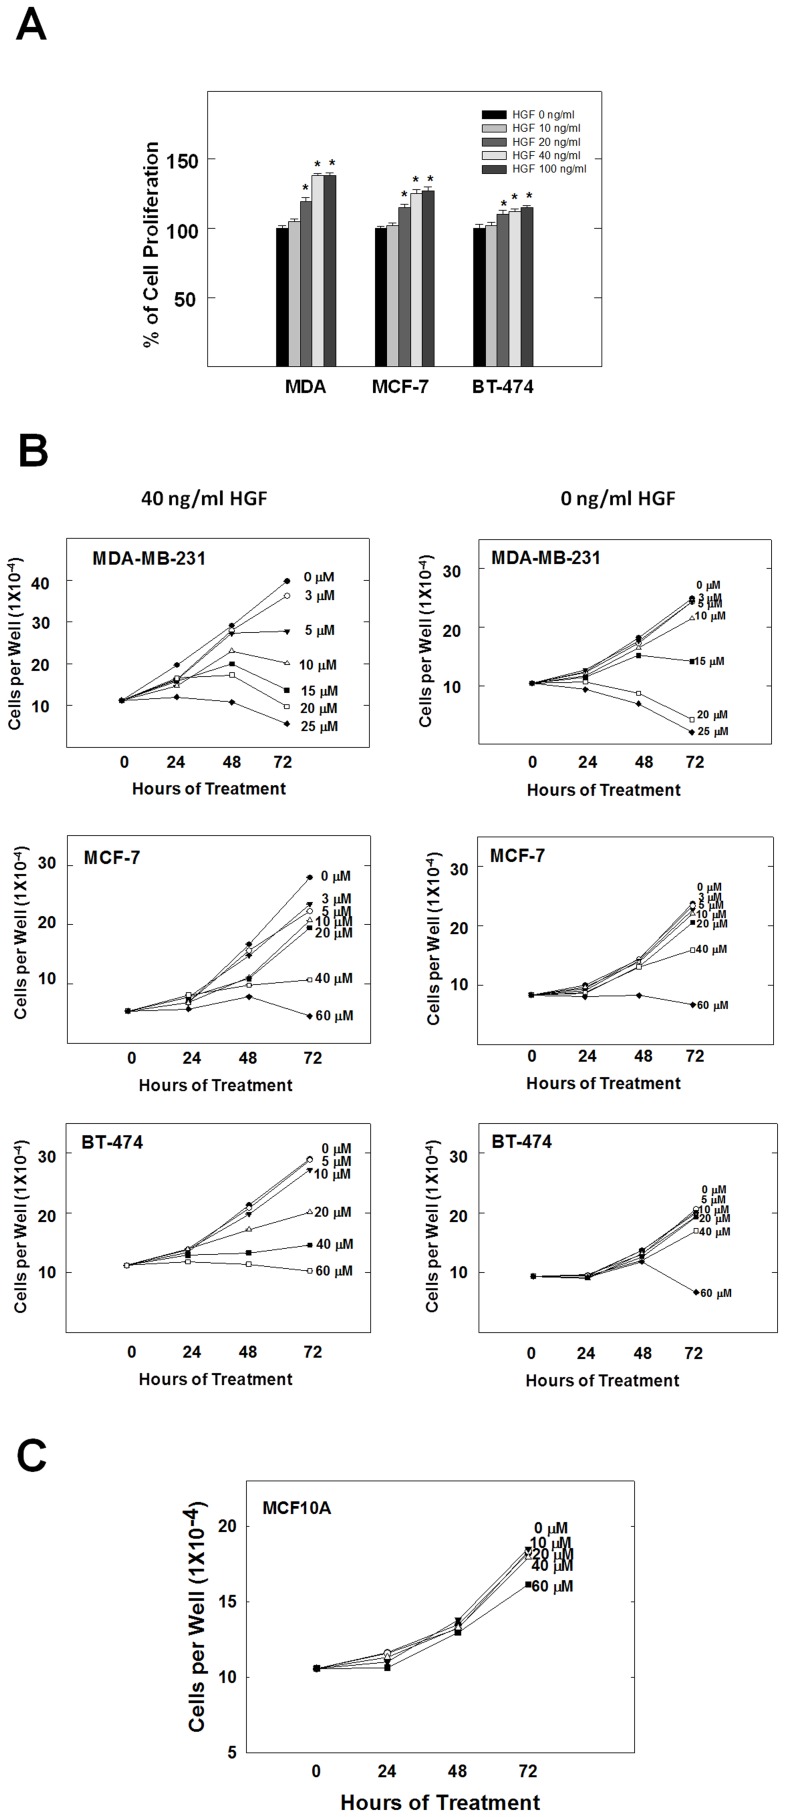
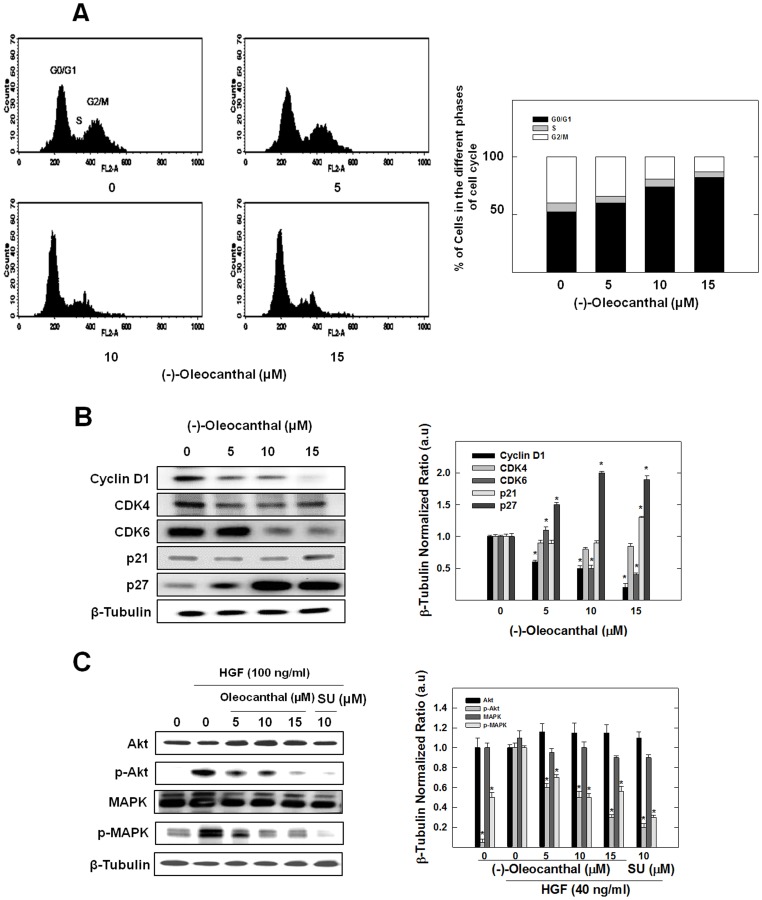
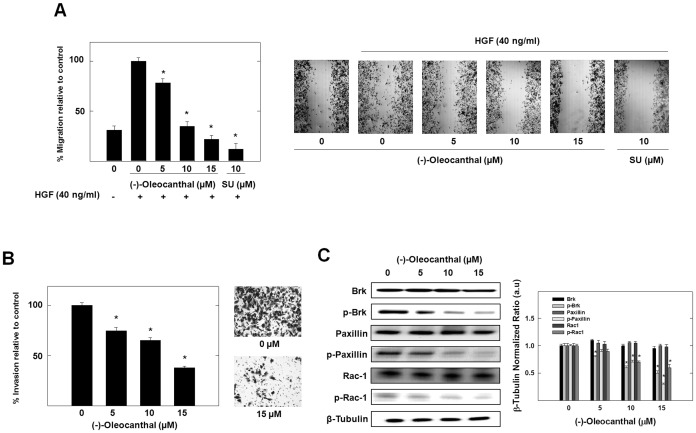
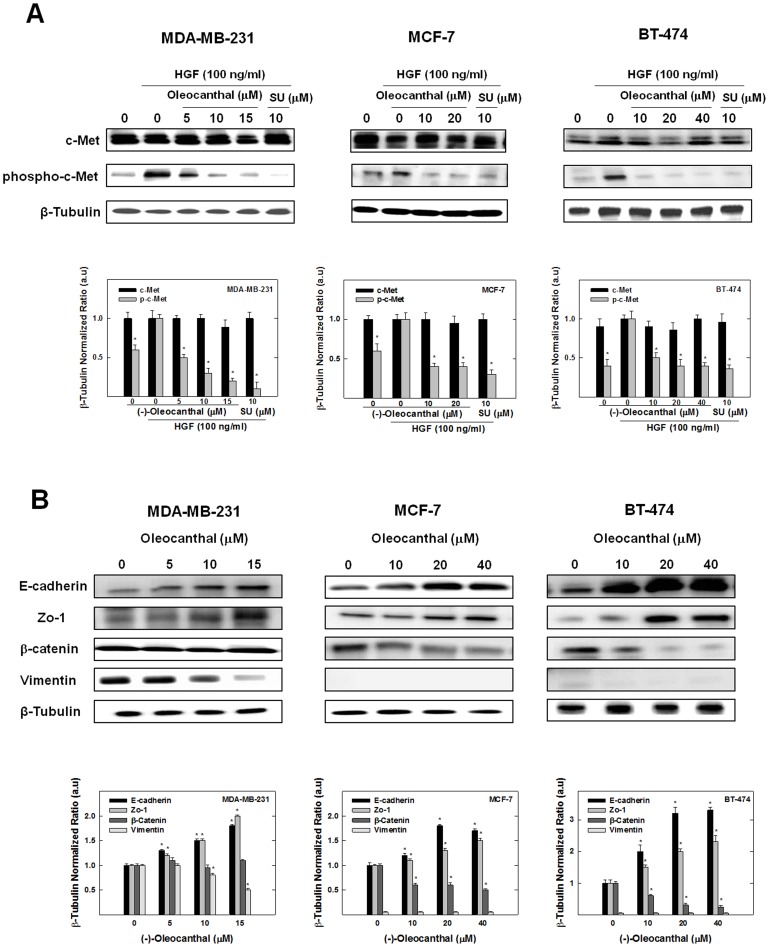
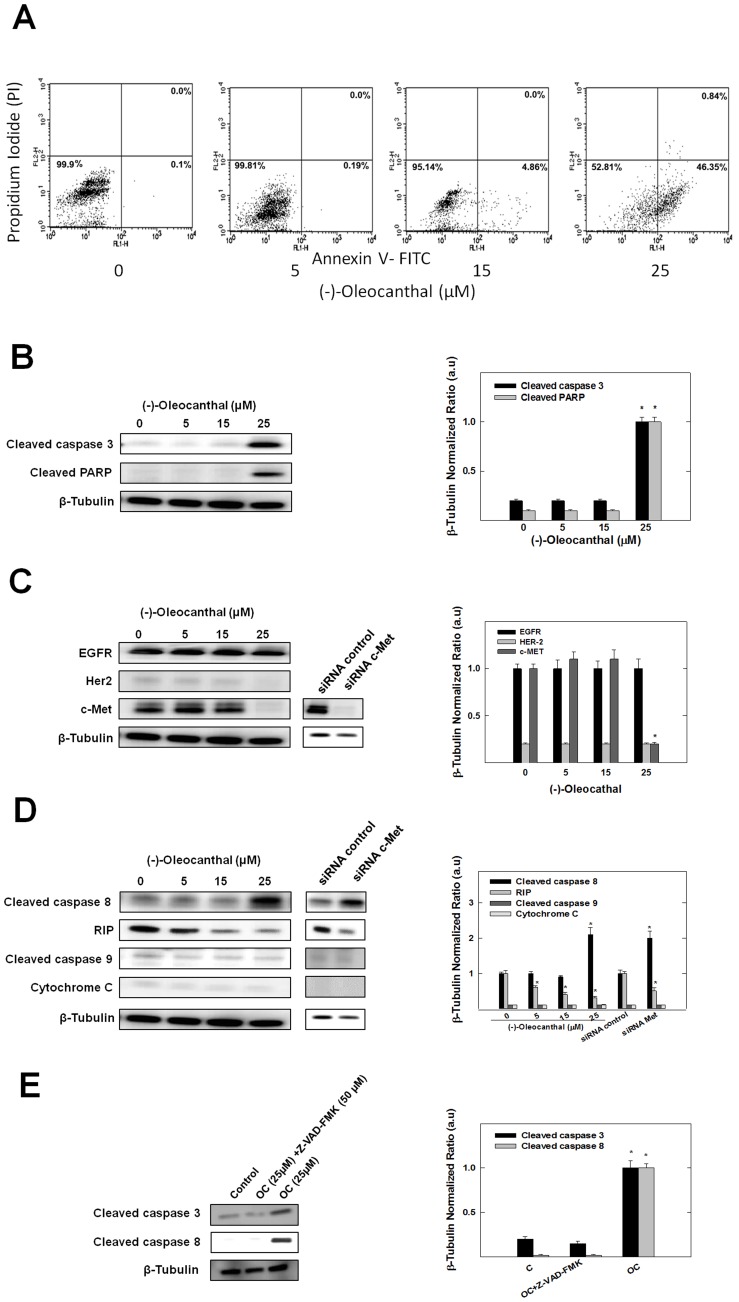
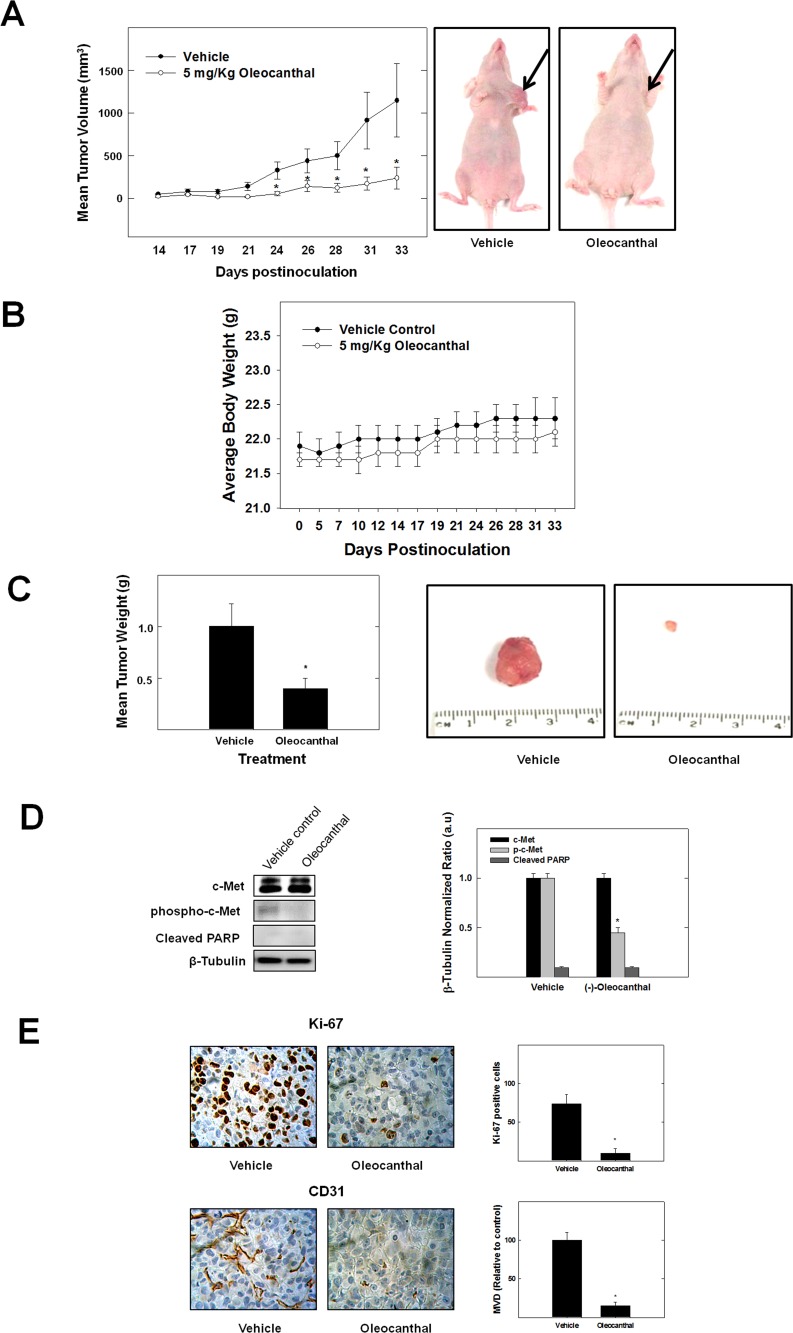
Dysregulation of the Hepatocyte growth factor (HGF)/c-Met signaling axis upregulates diverse tumor cell functions, including cell proliferation, survival, scattering and motility, epithelial-to-mesenchymal transition (EMT), angiogenesis, invasion, and metastasis. (-)-Oleocanthal is a naturally occurring secoiridoid from extra-virgin olive oil, which showed antiproliferative and antimigratory activity against different cancer cell lines. The aim of this study was to characterize the intracellular mechanisms involved in mediating the anticancer effects of (-)-oleocanthal treatment and the potential involvement of c-Met receptor signaling components in breast cancer. Results showed that (-)-oleocanthal inhibits the growth of human breast cancer cell lines MDA-MB-231, MCF-7 and BT-474 while similar treatment doses were found to have no effect on normal human MCF10A cell growth. In addition, (-)-oleocanthal treatment caused a dose-dependent inhibition of HGF-induced cell migration, invasion and G1/S cell cycle progression in breast cancer cell lines. Moreover, (-)-oleocanthal treatment effects were found to be mediated via inhibition of HGF-induced c-Met activation and its downstream mitogenic signaling pathways. This growth inhibitory effect is associated with blockade of EMT and reduction in cellular motility. Further results from in vivo studies showed that (-)-oleocanthal treatment suppressed tumor cell growth in an orthotopic model of breast cancer in athymic nude mice. Collectively, the findings of this study suggest that (-)-oleocanthal is a promising dietary supplement lead with potential for therapeutic use to control malignancies with aberrant c-Met activity.


Conflict of interest statement

Competing Interests: The authors have declared that no competing interests exist.

Figures

Figure 1
Figure 1. (-)-Oleocanthal and c-Met signaling.
(A) Schematic representation of HGF/c-Met signaling. (B) Chemical structure of (-)-oleocanthal.
Figure 2
Figure 2. (-)-Oleocanthal inhibits HGF-induced proliferation of MDA-MB-231, MCF-7 and BT-474 breast cancer cell lines.
(A) HGF stimulates the growth of human breast cancer cells in a dose-dependent manner with maximum effect at 40 ng/ml after 72 h culture period. (B) Effects of (-)-oleocanthal treatment on growth of MDA-MB-231, MCF-7 and BT-474 cancer cells in the presence or absence of 40 ng/ml HGF after 72 h treatment period. (C) Effects of (-)-oleocanthal treatment on the viability of non-tumorigenic human MCF10A mammary epithelial cells after a 72 h treatment period. In these assays, cells were plated at a density of 1×10⁴ cells per well in 96-well plates and maintained in media supplemented with 10% FBS and allowed to adhere overnight. The next day, cells were washed with PBS, divided into different treatment groups. Cells were fed fresh treatment media every other day for a 72 h treatment period. Viable cell count was determined by MTT assay. Vertical bars indicate the mean cell count ± SEM in each treatment group. *P<0.05 as compared with vehicle-treated controls.
Figure 3
Figure 3. (-)-Oleocanthal treatment inhibits HGF-induced G1/S cell cycle progression and mitogenic signaling in human MDA-MB-231 breast cancer cells.
(A) Flow cytometry analysis for cell cycle progression in control and (-)-oleocanthal-treated MDA-MB-231 cells. Cells in the various treatment groups were synchronized in G1 phase. Briefly, MDA-MB-231 cells were plated at a density of 1×10⁶ cells/100 mm plates in RPMI-1640 media supplemented with 10% FBS and allowed to adhere overnight. Cells were then washed twice with PBS and starved in control or treatment serum-free medium containing 0.5% FBS for 48 h to synchronize the cells in G1 phase. Afterwards, cells were fed various doses of (-)-oleocanthal in serum-free defined media containing 40 ng/ml HGF as the mitogen for 24 h. Left panel shows histograms generated using CellQuest software (PI staining). Right panel shows percentage of cells in each phase of cell cycle. Vertical bars show the average of 3 independent experiments. (B) Western blot analysis showing (-)-oleocanthal treatment effects on G1/S cell cycle regulatory proteins. Cells in the various treatment groups were synchronized in G1 phase in the same way described above. (-)-Oleocanthal treatment caused a marked downregulation of cyclin D1 and CDK6, while it caused upregulation of p21 and p27. (C) Western blot analysis showing (-)-oleocanthal treatment effects on c-Met downstream mitogenic signaling proteins Akt and MAPK. MDA-MB-231 cells were plated at a density of 1×10⁶ cells/100 mm culture plates in RPMI-1640 media supplemented with 10% FBS and allowed to adhere overnight. Cells were then washed twice with PBS and starved in control or treatment medium containing 0.5% FBS for 72 h and stimulated with 100 ng/ml human recombinant HGF for 10 min before cell lysis. SU11274 was used as a positive control. Afterwards, whole cell lysates were prepared for subsequent separation by polyacrylamide gel electrophoresis followed by Western blot analysis. Scanning densitometric analysis was performed on all blots done in triplicate and the integrated optical density of each band was normalized with corresponding β-tubulin, as shown in bar graphs beside their respective Western blot images. Vertical bars in the graph indicate the normalized integrated optical density of bands visualized in each lane ± SEM, *P<0.05 as compared with vehicle-treated controls.
Figure 4
Figure 4. (-)-Oleocanthal treatment caused a dose-dependent suppression of HGF-induced mammary tumor cell migration and invasion and Brk/paxillin/Rac1 pathway signaling.
(A) Wound healing assay. Left panel shows quantitative analysis of the percentage of gap reduction (i.e., wound closure) in various treatment groups in MDA-MB-231 cancer cells. Vertical bars indicate the percentage of wound closure at 24 h after wounding was calculated relative to the wound distance at time 0 (t0) ± SEM in each treatment group. *P<0.05 as compared with vehicle-treated control. Right panel represents photomicrographs of wound healing assay showing (-)-oleocanthal treatment blocked the migration MDA-MB-231 cells in response to HGF stimulation. The treatment with 10 µM SU11274 was used as a positive control. (B) Transwell invasion chamber assay. The cells were treated with 5, 10, and 15 µM (-)-oleocanthal for 24 h. Left panel shows quantitative analysis of the percentage of cells invading the basement membrane at the end of treatment period. Vertical bars indicate the percentage of cells invading the basement membrane ± SEM in each treatment group. *P<0.05 as compared with vehicle-treated controls. Right panel represents photomicrographs of cells invading the basement membrane and 15 µM (-)-oleocanthal treatment blocked the invasion of MDA-MB-231 cells. (C) Western blot analysis showing (-)-oleocanthal treatment effects on Brk/Paxillin/Rac1 pathway signaling after 72 h treatment in MDA-MB-231 cancer cells. Cells were plated at 1×10⁶ cells/100 mm culture plates, allowed to attach overnight and then washed with PBS and incubated in the respective control or treatment in serum-free defined media containing 40 ng/ml HGF as the mitogen for 72 h. Afterwards, whole cell lysates were prepared for subsequent separation by polyacrylamide gel electrophoresis followed by Western blot analysis. Scanning densitometric analysis was performed on all blots done in triplicate and the integrated optical density of each band was normalized with corresponding β-tubulin, as shown in bar graphs beside their respective Western blot images. Vertical bars in the graph indicate the normalized integrated optical density of bands visualized in each lane ± SEM, *P<0.05 as compared with vehicle-treated controls.
Figure 5
Figure 5. (-)-Oleocanthal treatment inhibits HGF-induced Met activation, stabilizes the epithelial phenotype, and reduces mesenchymal phenotype in breast cancer cells.
(A) Western blot analysis. (-)-Oleocanthal caused a dose-dependent inhibition of HGF-induced phosphorylation of c-Met in MDA-MB-231, MCF-7, and BT-474 breast tumor cells with no effect on total Met levels. Cells were plated at 1×10⁶ cells/100 mm culture plates in RPMI-1640 media supplemented with 10% FBS and allowed to adhere overnight. Cells were then washed twice with PBS and starved in control or treatment medium containing 0.5% FBS for 72 h and stimulated with 100 ng/ml human recombinant HGF for 10 min before cell lysis. SU11274 was used as a positive control. (B) Western blot analysis. (-)-Oleocanthal resulted in a marked increase in the level of epithelial markers E-cadherin and Zo-1 in MDA-MB-231, MCF-7, and BT-474 cells and a decrease of mesenchymal marker vimentin expression (in MDA-MB-231 cells) compared to the vehicle-treated control groups. (-)-Oleocanthal treatment resulted in downregulation of β-catenin in MCF-7 and BT-474 cells. Cells were plated at 1×10⁶ cells/100 mm culture plates, allowed to attach overnight and then washed with PBS and incubated in the respective control or treatment in serum-free defined media containing 40 ng/ml HGF as the mitogen for 72 h. Whole cell lysates were prepared for subsequent separation by polyacrylamide gel electrophoresis followed by Western blot analysis. Scanning densitometric analysis was performed on all blots done in triplicate and the integrated optical density of each band was normalized with corresponding β-tubulin, as shown in bar graphs below their respective Western blot images. Vertical bars in the graph indicate the normalized integrated optical density of bands visualized in each lane ± SEM, *P<0.05 as compared with vehicle-treated controls.
Figure 6
Figure 6. (-)-Oleocanthal treatment induces apoptosis at 25 µM in MDA-MB-231 breast cancer cells.
(A) Flow cytometry analysis. Cells were plated at a density of 5×10⁶ cells/100 mm culture plates, allowed to attach overnight. Afterwards, cells were incubated in the respective control or (-)-oleocanthal-treated RPMI-1640 medium containing 40 ng/ml HGF for 24 h. At the end of the experiment, cells in each treatment group were trypsinized, washed then resuspended in ice-cold 1X Annexin V Binding Buffer. Afterwards, the cells were treated as described in the Materials and Methods. In the dot plot of double variable flow cytometry, LL quadrant (FITC −/PI -) shows living cells; UR quadrant (FITC +/PI +) stands for late apoptotic cells; and LR quadrant (FITC +/PI -) represents early apoptotic cells. (B) Western blot analysis of cleaved caspase 3 and cleaved PARP. (-)-Oleocanthal treatment at 25 µM for 72 h markedly increased levels of cleaved caspase-3 and cleaved PARP. (C) Western blot analysis. (-)-Oleocanthal at 25 µM for 72 h downregulates c-Met levels without affecting EGFR levels, and right panel shows that transfection of MDA-MB-231 cells with c-Met-targeted siRNA totally abolished c-Met protein expression. (D) Western blot analysis of cleaved caspase 8, RIP, cleaved caspase 9 and cytochrome c. Treatment with 25 µM (-)-oleocanthal increased the cleavage of caspase-8 and RIP, but not caspase-9 or cytochrome c. Right panel shows that c-Met-targeted siRNA yielded a pattern of apoptosis that is similar to that following treatment with (-)-oleocanthal at 25 µM for 72 h by causing an increase in caspase-8 and RIP cleavage, with no effect on caspase-9 and cytochrome c levels. (E) Effect of Z-VAD-FMK on (-)-oleocanthal-induced apoptosis. MDA-MB-231 cells were treated with 25 µM (-)-oleocanthal in the presence or absence of caspase inhibitor Z-VAD-FMK (50 µM). After 24-h incubation, cells were analyzed to examine cell death by measuring caspase 3 and caspase 8 cleavage detected by Western blotting. In all the above experiments, whole cell lysates were prepared for subsequent separation by polyacrylamide gel electrophoresis followed by Western blot analysis. Scanning densitometric analysis was performed on all blots done in triplicate and the integrated optical density of each band was normalized with corresponding β-tubulin, as shown in bar graphs beside their respective Western blot images. Vertical bars in the graph indicate the normalized integrated optical density of bands visualized in each lane ± SEM, *P<0.05 as compared with vehicle-treated controls.
Figure 7
Figure 7. (-)-Oleocanthal treatment suppresses tumor growth in human tumor xenograft model.
MDA-MB-231/GFP human breast cancer cells were cultured and resuspended in serum-free DMEM medium (20 µl). After anesthesia, cell suspensions (1×10⁶ cells/20 µl) were inoculated subcutaneously into the second mammary gland fat pad just beneath the nipple of each athymic nude mouse to generate orthotopic breast tumors. At 48 h post-inoculation, the mice were randomly divided into two groups: i) the vehicle-treated control group (n = 5), ii) the (-)-oleocanthal-treated group (n = 5). Treatment (3X/week) started 5 days postinoculation with intraperitoneal (i.p.) administered vehicle control or 5 mg/kg (-)-oleocanthal. (A) Left panel; tumor size was evaluated periodically during treatment at indicated days postinoculation. Tumor volume (V) was calculated by V = L/2 x W2, where L was the length and W was the width of tumors. Points, mean of tumor volume in mm3 of several tumors (n = 5) during the course of the treatment period; bars ± SEM. *P<0.05 as compared to vehicle-treated control. Right panel; shown are two mice harboring human breast cancer. The mouse on the right shows suppression of tumor growth with (-)-oleocanthal treatment (5 mg/kg/day) compared to vehicle treated control mouse on the left. (B) No significant change in body weight was observed among treated animals, indicating the safety of (-)-oleocanthal treatment. Error bars indicate SEM for n = 5. (C) Vertical bars indicate mean tumor weight at the end of the experiment (left panel). *P<0.05 compared to vehicle-treated controls. Right panel shows primary breast tumors from mice with vehicle-treated cancer (left), and cancer treated with (-)-oleocanthal (5 mg/kg/day) (right). (D) Protein expression of c-Met, phospho-c-Met and Cleaved PARP in breast tumors detected by Western blot. Scanning densitometric analysis was performed on all blots done in triplicate and the integrated optical density of each band was normalized with corresponding β-tubulin, as shown in bar graphs beside their respective Western blot images. Vertical bars in the graph indicate the normalized integrated optical density of bands visualized in each lane ± SEM, *P<0.05 as compared with vehicle-treated controls. (E) Immunostaining of sections (left panel) obtained from vehicle-treated or (-)-oleocanthal-treated (5 mg/kg/day) mice against Ki-67 (mitosis marker), CD31 (endothelial marker). Right panel shows quantification of Ki-67 positive cells and microvessel density (MVD). Ki-67+ cells in breast cancer tissues were examined in 5 areas at a magnification of ×200. Microvessel density (MVD) of breast tumor tissue sections was evaluated. Any CD31+stained endothelial cell or endothelial cell cluster was counted as one microvessel. The mean microvessel count of the five most vascular areas was taken as the MVD, which was expressed as the absolute number of microvessels per 1.485 mm2 (×200 field). Vertical indicate the average of 5 readings ± SEM, *P<0.05 as compared with vehicle-treated controls.

References

    1. American Cancer Society, http://www.cancer.org/Cancer/BreastCancer/OverviewGuide/breast-cancer-ov... (Accessed November 2013).
    1. Giordano S, Ponzetto C, Di Renzo M, Cooper C, Comoglio P (1989) Tyrosine kinase receptor indistinguishable from the c-met protein. Nature 11: 155–156. - PubMed
    1. Park M, Dean M, Kaul K, Braun MJ, Gonda MA, et al. (1987) Sequence of MET protooncogene cDNA has features characteristic of the tyrosine kinase family of growth-factor receptors. Proc Natl Acad Sci USA 84: 6379–6383. - PMC - PubMed
    1. Eder JP, Woude GFV, Boerner SA, LoRusso PM (2009) Novel therapeutic inhibitors of the c-Met signaling pathway in cancer. Clin Cancer Res 15: 2207–2214. - PubMed
    1. Peruzzi B, Bottaro DP (2006) Targeting the c-Met signaling pathway in cancer. Clin Cancer Res 12: 3657–3660. - PubMed

Publication types

MeSH terms