

Gene expression analysis reveals inhibition of radiation-induced TGFβ-signaling by hyperbaric oxygen therapy in mouse salivary glands
- PMID: 24849810
- PMCID: PMC4107101
- DOI: 10.2119/molmed.2014.00003
Gene expression analysis reveals inhibition of radiation-induced TGFβ-signaling by hyperbaric oxygen therapy in mouse salivary glands
Abstract
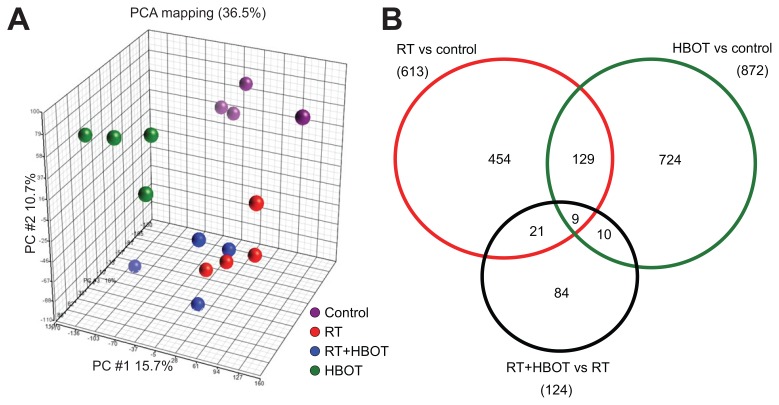
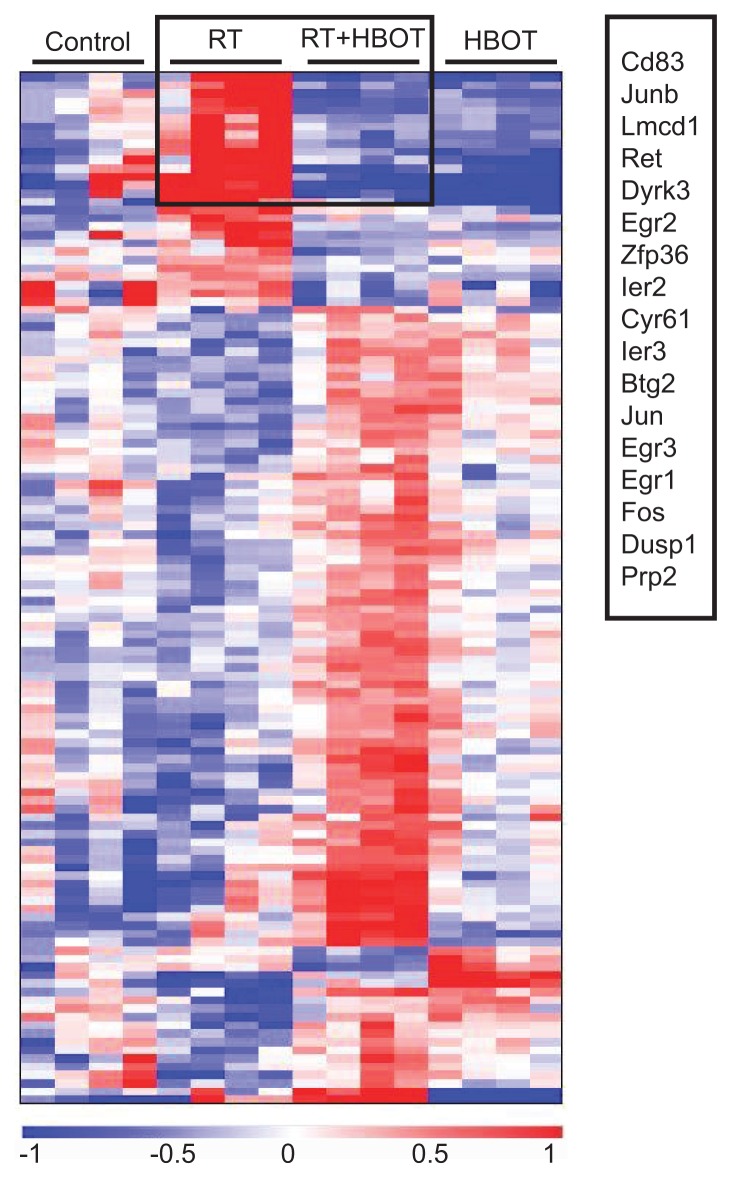
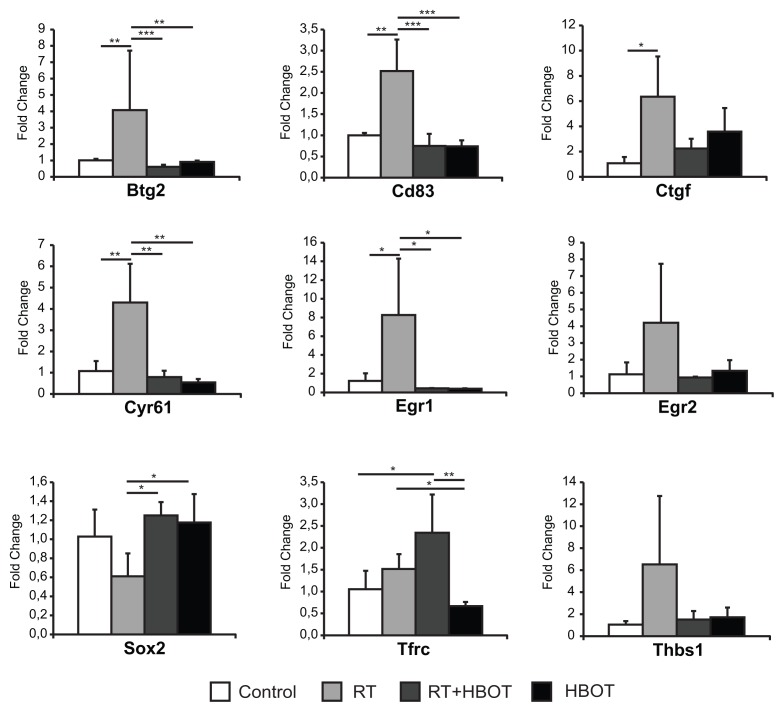
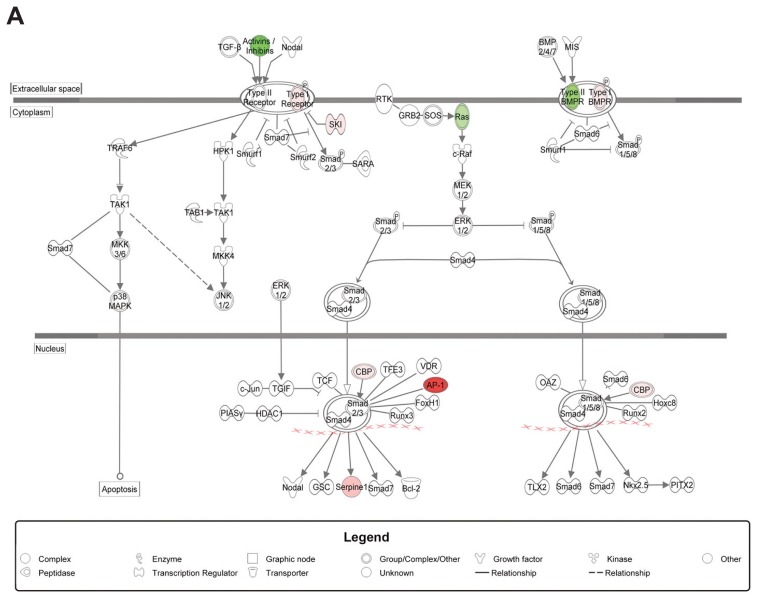
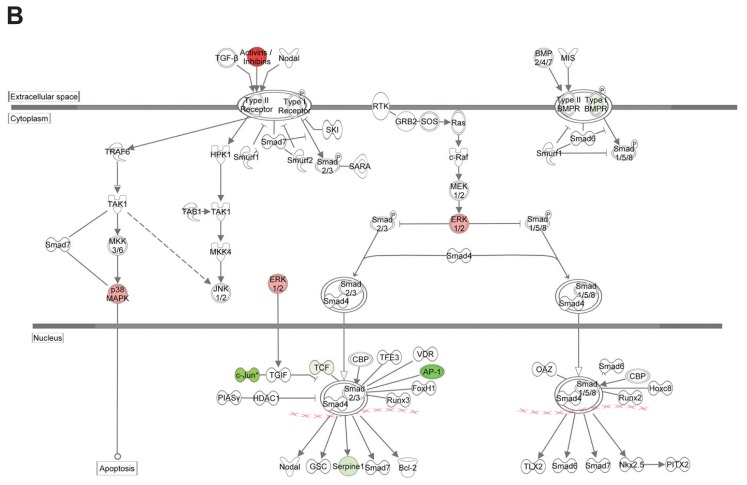
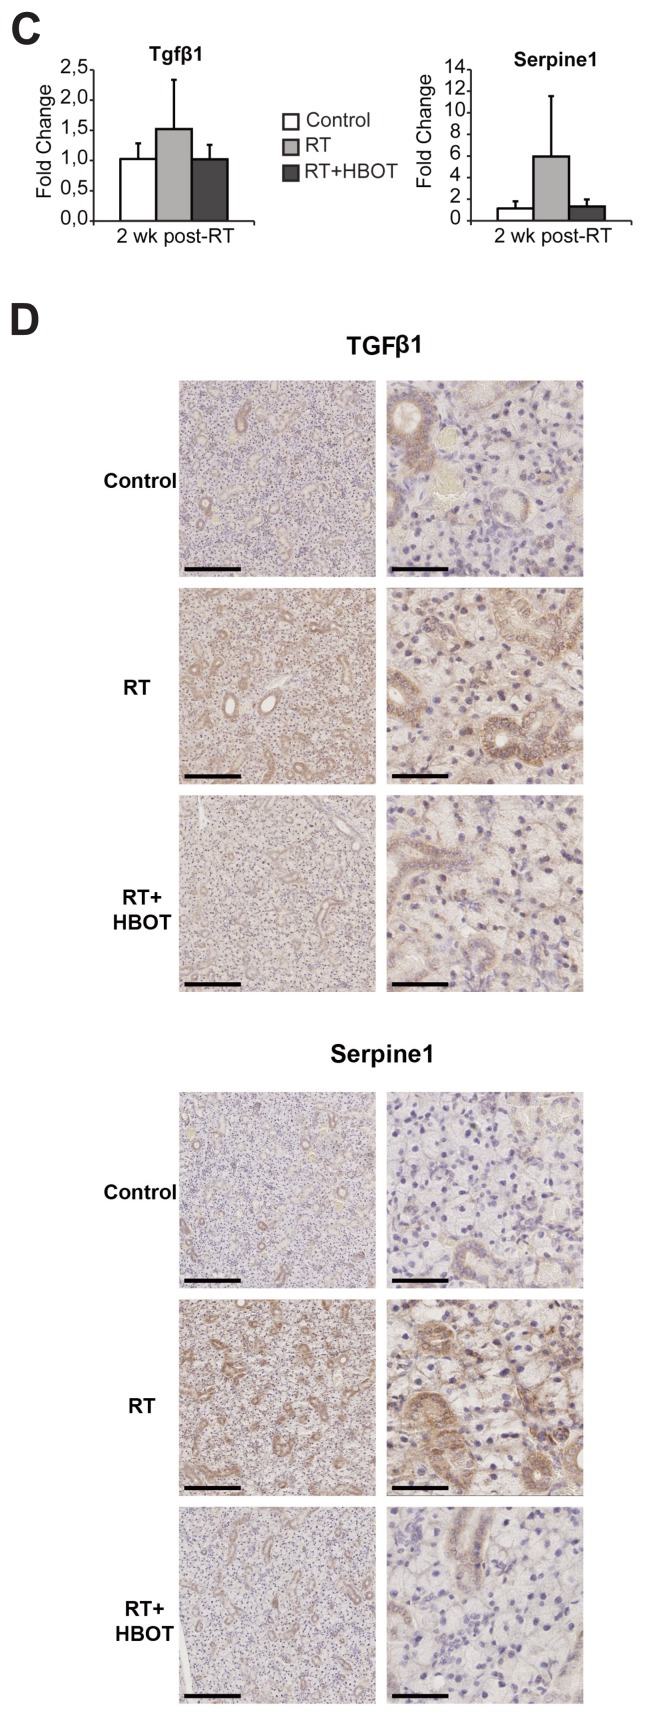
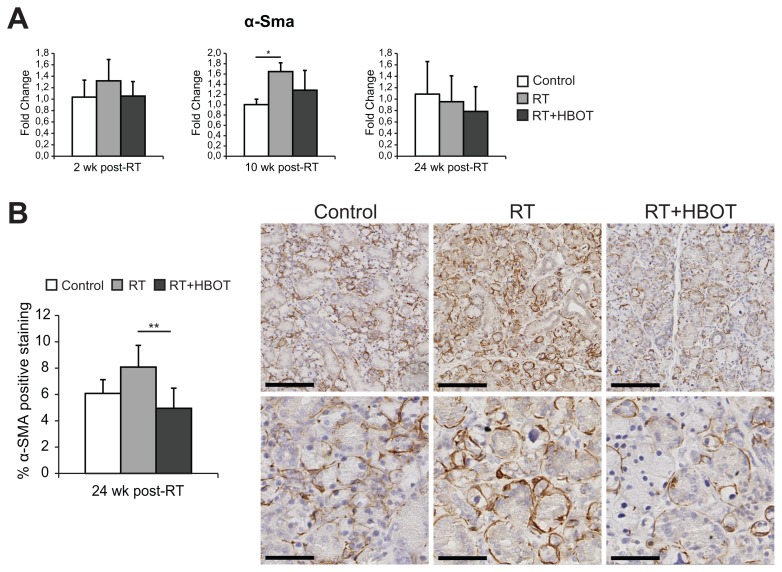
A side effect of radiation therapy in the head and neck region is injury to surrounding healthy tissues such as irreversible impaired function of the salivary glands. Hyperbaric oxygen therapy (HBOT) is clinically used to treat radiation-induced damage but its mechanism of action is largely unknown. In this study, we investigated the molecular pathways that are affected by HBOT in mouse salivary glands two weeks after radiation therapy by microarray analysis. Interestingly, HBOT led to significant attenuation of the radiation-induced expression of a set of genes and upstream regulators that are involved in processes such as fibrosis and tissue regeneration. Our data suggest that the TGFβ-pathway, which is involved in radiation-induced fibrosis and chronic loss of function after radiation therapy, is affected by HBOT. On the longer term, HBOT reduced the expression of the fibrosis-associated factor α-smooth muscle actin in irradiated salivary glands. This study highlights the potential of HBOT to inhibit the TGFβ-pathway in irradiated salivary glands and to restrain consequential radiation induced tissue injury.
Figures
Similar articles
-
Effects of hyperbaric oxygen therapy on the viability of irradiated soft head and neck tissues in mice.Oral Dis. 2014 Apr;20(3):e111-9. doi: 10.1111/odi.12162. Epub 2013 Jul 19. Oral Dis. 2014. PMID: 23865954
-
Hyperbaric oxygen therapy as a prevention modality for radiation damage in the mandibles of mice.J Craniomaxillofac Surg. 2015 Mar;43(2):214-9. doi: 10.1016/j.jcms.2014.11.008. Epub 2014 Nov 18. J Craniomaxillofac Surg. 2015. PMID: 25523397
-
Integration of metabolomics and transcriptomics reveals convergent pathways driving radiation-induced salivary gland dysfunction.Physiol Genomics. 2021 Mar 1;53(3):85-98. doi: 10.1152/physiolgenomics.00127.2020. Epub 2021 Feb 1. Physiol Genomics. 2021. PMID: 33522389 Free PMC article.
-
Gene transfer-mediated functional restoration for irradiated salivary glands.Chin J Dent Res. 2011;14(1):7-13. Chin J Dent Res. 2011. PMID: 21734941 Review.
-
Transfer of the AQP1 cDNA for the correction of radiation-induced salivary hypofunction.Biochim Biophys Acta. 2006 Aug;1758(8):1071-7. doi: 10.1016/j.bbamem.2005.11.006. Epub 2005 Dec 5. Biochim Biophys Acta. 2006. PMID: 16368071 Review.
Cited by
-
TGF-β Pathway in Salivary Gland Fibrosis.Int J Mol Sci. 2020 Nov 30;21(23):9138. doi: 10.3390/ijms21239138. Int J Mol Sci. 2020. PMID: 33266300 Free PMC article. Review.
-
Extracellular matrix turnover in salivary gland disorders and regenerative therapies: Obstacles and opportunities.J Oral Biol Craniofac Res. 2023 Nov-Dec;13(6):693-703. doi: 10.1016/j.jobcr.2023.08.009. Epub 2023 Sep 12. J Oral Biol Craniofac Res. 2023. PMID: 37719063 Free PMC article.
-
Radiation-induced skin reactions: oxidative damage mechanism and antioxidant protection.Front Cell Dev Biol. 2024 Oct 9;12:1480571. doi: 10.3389/fcell.2024.1480571. eCollection 2024. Front Cell Dev Biol. 2024. PMID: 39450273 Free PMC article. Review.
-
The Role of Hyperbaric Oxygen Therapy in the Treatment of Surgical Site Infections: A Narrative Review.Medicina (Kaunas). 2023 Apr 14;59(4):762. doi: 10.3390/medicina59040762. Medicina (Kaunas). 2023. PMID: 37109720 Free PMC article. Review.
-
TGFβ2-Driven Ferritin Degradation and Subsequent Ferroptosis Underlie Salivary Gland Dysfunction in Postmenopausal Conditions.Adv Sci (Weinh). 2024 Dec;11(47):e2400660. doi: 10.1002/advs.202400660. Epub 2024 Nov 1. Adv Sci (Weinh). 2024. PMID: 39481440 Free PMC article.
References
-
- Radvansky LJ, Pace MB, Siddiqui A. Prevention and management of radiation-induced dermatitis, mucositis, and xerostomia. Am J Health Syst Pharm. 2013;70:1025–32. - PubMed
-
- Konings AW, Coppes RP, Vissink A. On the mechanism of salivary gland radiosensitivity. Int J Radiat Oncol Biol Phys. 2005;62:1187–94. - PubMed
-
- Takagi K, et al. Secretion of saliva in X-irradiated rat submandibular glands. Radiat Res. 2003;159:351–60. - PubMed
Publication types
MeSH terms
Substances
LinkOut - more resources
Full Text Sources
Other Literature Sources
