. 2014 May-Jun;17(3):205-16.

Policies and events affecting prescription opioid use for non-cancer pain among an insured patient population

Affiliations

Policies and events affecting prescription opioid use for non-cancer pain among an insured patient population

Brian K Ahmedani et al. Pain Physician. 2014 May-Jun.

Abstract

Background: Rising prescription opioid use and abuse have prompted widespread concern. However, to date there have been few rigorous investigations into the policies and events which may have contributed to these trends.

Objective: This study investigates trends in opioid use and related adverse events among individuals with non-cancer pain before and after implementation of major national policies.

Study design: The study used a longitudinal prospective study design. The analysis was limited to adults (age = 18 years) without a recorded cancer diagnosis. Pharmacy claims were used to assess rates of prescription opioid use, the strength of opioids dispensed, the proportion using opioids chronically, and related adverse events. Time trend analysis was used to identify changes in these rates over time. The study was Institutional Review Board approved.

Setting: Study patients were members of a large, health maintenance organization in southeast Michigan, with longitudinal records of prescription opioid use.

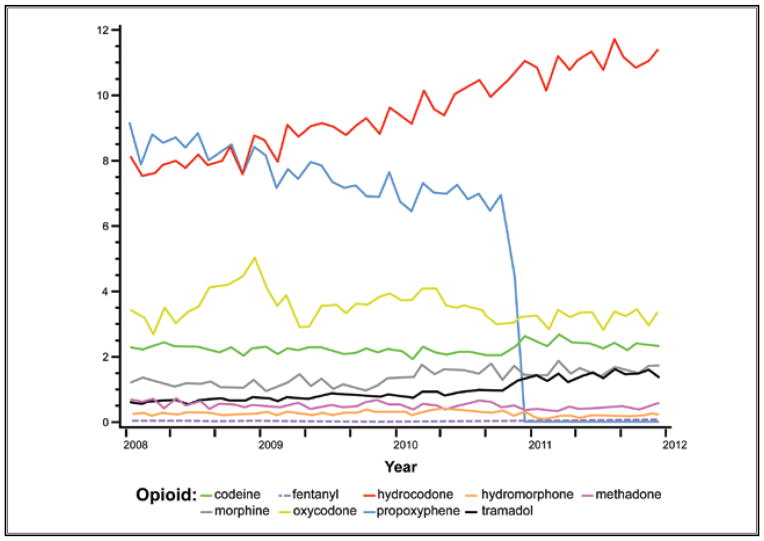
Results: The analysis comprised 523,623 individuals and 1,066,700 opioid pharmacy fills from January 1, 1997, to December 31, 2011. Contemporaneous with the implementation of health organization accreditation criteria requiring assessment and treatment of pain in all patients beginning January 2001, we observed a consistent and unabated increase in the rate of opioid fills and the proportion of chronic use. A parallel increase in the annual rate of adverse events was also observed. Similarly, we observed a continuous rise in the average strength of opioid fills following January 2001 with the exception of a single drop in December 2010, which was attributable to the withdrawal of propoxyphene from the U.S. market.

Limitations: This was an observational study and not a trial. Other long-term opioid-related benefits or harms, including functional status, quality of life, and substance use disorder, were not assessed.

Conclusions: This study provides temporal evidence for a rise in prescription opioid use after implementation of health organization accreditation criteria requiring standardized management of all individuals with pain.


Conflict of interest statement

Conflict of interest: Each author certifies that he or she, or a member of his or her immediate family, has no commercial association (i.e., consultancies, stock ownership, equity interest, patent/licensing arrangements, etc.) that might pose a conflict of interest in connection with the submitted manuscript.

Figures

Fig. 1
Fig. 1
Trends in the percentage of opioid analgesic prescription fills, 1997 – 2011. The red line shows the proportion of health plan members who filled an opioid prescription per month. A solid black regression line shows the trend in each time period. The vertical dashed line in January 2001 represents when the Joint Commission on Accreditation of Healthcare Organizations pain management standards were implemented. The vertical dashed line in November 2010 represents when propoxyphene was withdrawn from the U.S. market.
Fig. 2
Fig. 2
Trends in the percentage of opioid analgesic prescription fills by schedule of opioid analgesic, 1997 – 2011. The red line shows the proportion of health plan members who filled a schedule III opioid prescription per month. The same trend is shown for schedule II (yellow line), schedule IV (blue line, propoxyphene fills only), and non-scheduled (black line, tramadol fills only) opioid prescriptions each month.
Fig. 3
Fig. 3
Trends in average monthly morphine dose equivalents for opioid analgesic prescription fills, 1997 – 2001. The red line shows the average monthly strength of all opioid prescriptions filled by health plan members as measured by morphine dose equivalents. A solid black regression line shows the trend in each time period. The vertical dashed line in January 2001 represents when the Joint Commission on Accreditation of Healthcare Organizations pain management standards were implemented. The vertical dashed line in November 2010 represents when propoxyphene was withdrawn from the U.S. market.
Fig. 4
Fig. 4
Trends in average monthly morphine dose equivalents by preparation of opioid analgesic, 2008 – 2011. This figure shows the average monthly strength in morphine dose equivalents of each opioid preparation out of the total number of opioid prescriptions filled among health plan members from 2008 through 2011. In other words, this chart shows the combined contribution of both preparation strength and frequency of use. Commonly prescribed opioids, such as propoxyphene (blue) and hydrocodone (red), comprise a larger share of the monthly morphine dose equivalents when all opioid prescription fills shown are considered. The reduction in propoxyphene shown here corresponds to the time of the reduction in the overall average monthly morphine dose equivalents per prescription in November 2010, as shown in Fig. 3.
Fig. 5
Fig. 5
Trend in the percentage of chronic opioid use, 1997 – 2011. Chronic use was defined as filling a prescription for an opioid in 6 of the 7 preceding months. The red line represents the proportion of chronic opioid users among health plan members receiving an opioid prescription in each month. The solid black regression line represents the time trend in chronic opioid use. The vertical dashed lines represent the implementation of the Joint Commission on Accreditation of Healthcare Organizations pain management standards in January 2001 and the withdrawal of propoxyphene from the U.S. market in November 2010.
Fig. 6
Fig. 6
Annual rate of opioid-related adverse events among health plan members, 1997 – 2011. Opioid-related adverse events are defined as all opioid-related poisonings and overdoses. The red line shows the annual rate of all opioid-related adverse events per 100,000 health plan members.
Fig. 7
Fig. 7
Trends in the percentage of opioid analgesic prescription fills, 1997 – 2011. Shown is the proportion of health plan members who filled an opioid prescription per month using LOESS regression curves. The LOESS smoothing parameter was varied according the number of data points used in plotting each local regression curve: 5% (A), 20% (B), and 40% (C). The vertical black line is drawn at January 1, 2001, to demonstrate the point at which the JCAHO pain management standards were initiated.

References

    1. Berry PH, Dahl JL. The new JCAHO pain standards: Implications for pain management nurses. Pain Manag Nurs. 2000;1:3–12. - PubMed
    1. Berry PH. Getting ready for JCAHO – just meeting the standards or really improving pain management. Clin J Oncol Nurs. 2001;5:110–112. - PubMed
    1. Lanser P, Gesell S. Pain management: The fifth vital sign. Healthc Benchmarks. 2001;8:68–70. 62. - PubMed
    1. Cleeland CS, Reyes-Gibby CC, Schall M, Nolan K, Paice J, Rosenberg JM, Tollett JH, Kerns RD. Rapid improvement in pain management: The Veterans Health Administration and the Institute for Healthcare improvement collaborative. Clin J Pain. 2003;19:298–305. - PubMed
    1. Phillips DM. JCAHO pain management standards are unveiled. Joint Commission on Accreditation of Healthcare Organizations. JAMA. 2000;284:428–429. - PubMed

Publication types

MeSH terms

Substances