. 2015 Jan;8(1):38-48.
doi: 10.1038/mi.2014.40. Epub 2014 May 21.

Lymph-borne CD8α+ dendritic cells are uniquely able to cross-prime CD8+ T cells with antigen acquired from intestinal epithelial cells

Affiliations
Free PMC article

Lymph-borne CD8α+ dendritic cells are uniquely able to cross-prime CD8+ T cells with antigen acquired from intestinal epithelial cells

V Cerovic et al. Mucosal Immunol. 2015 Jan.
Free PMC article

Abstract

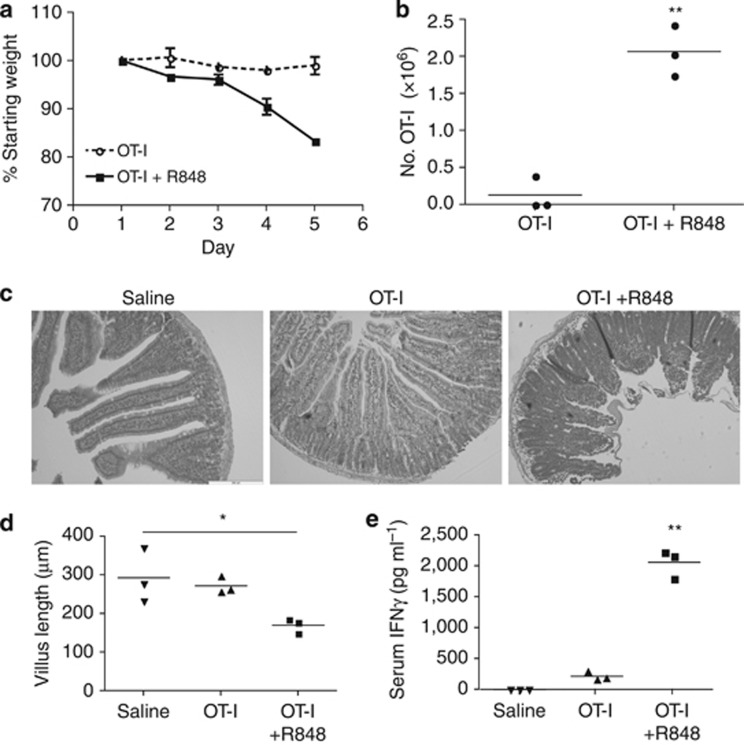
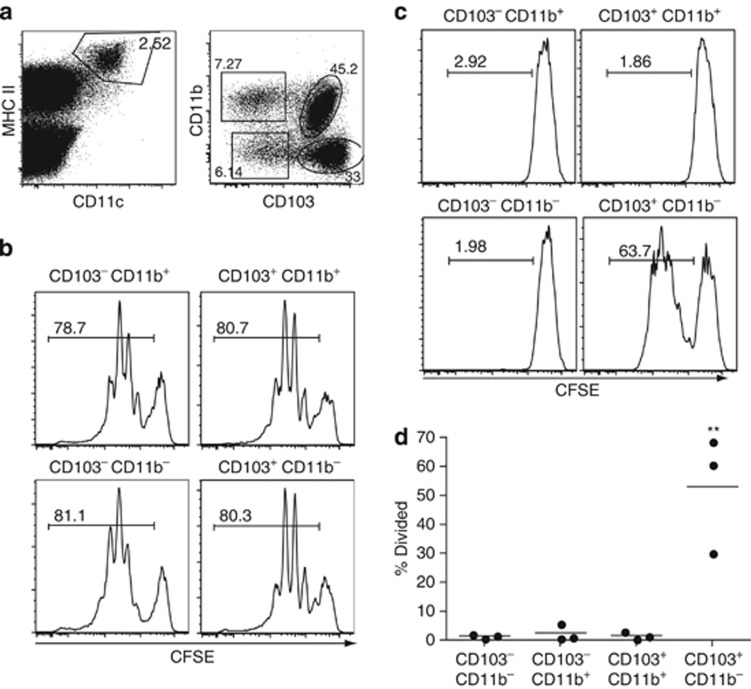
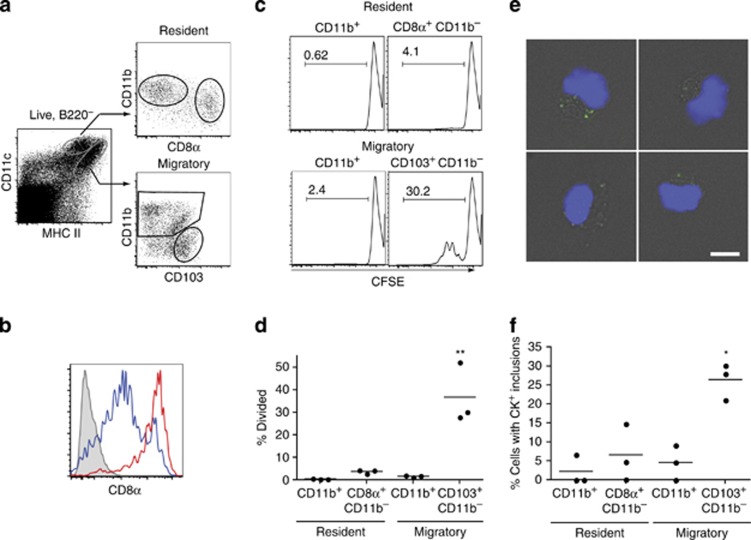
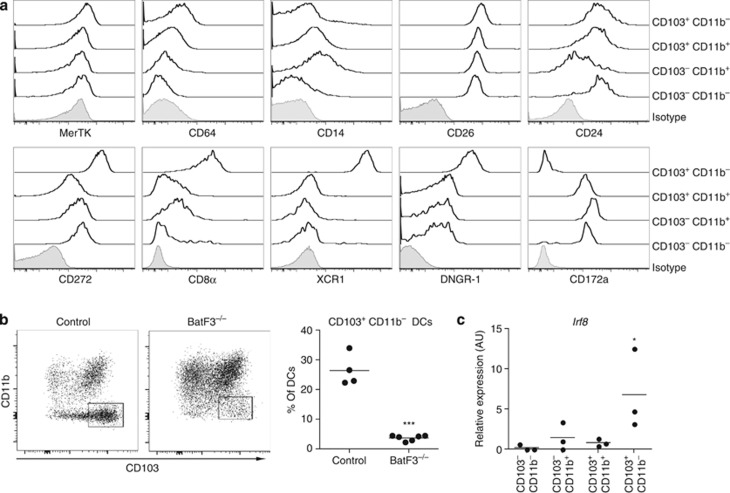
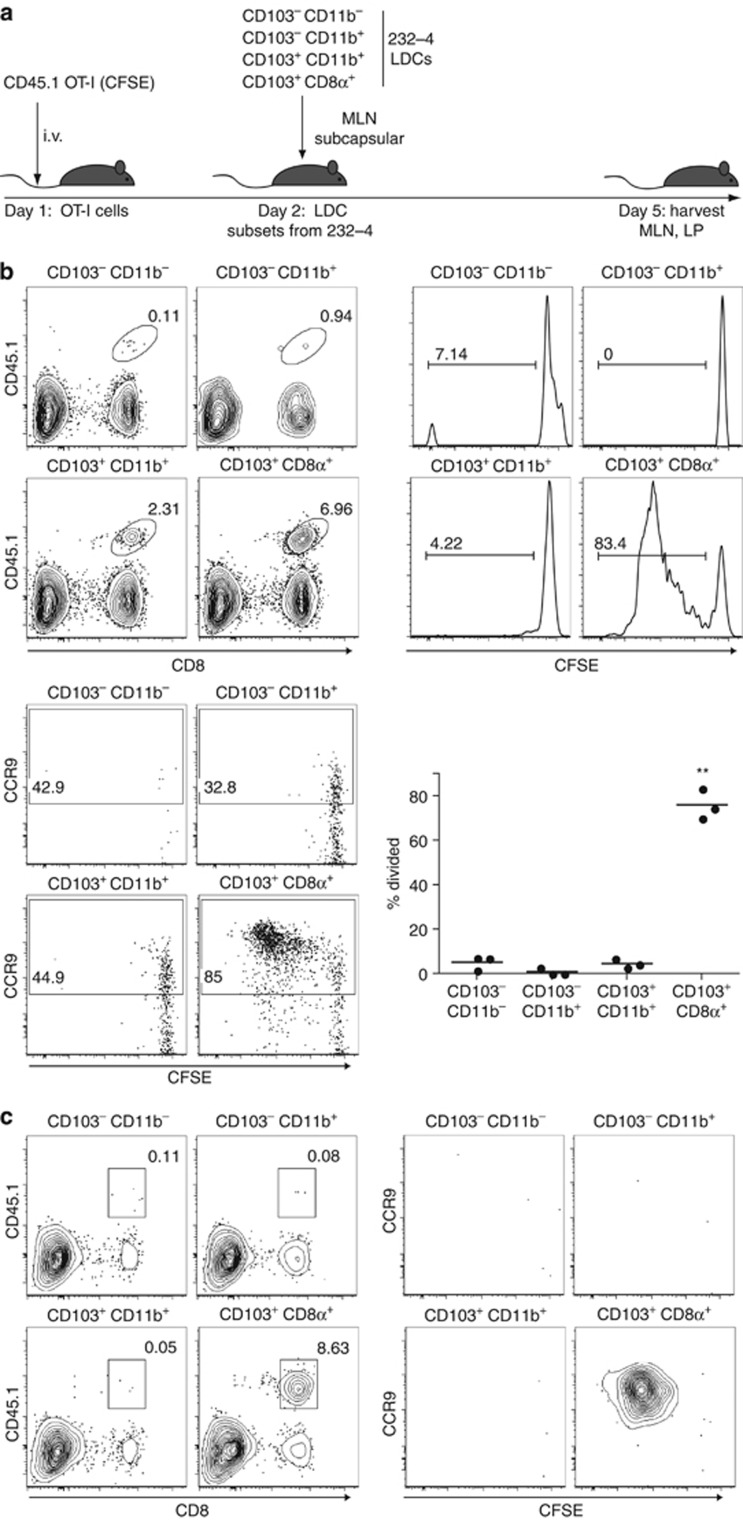
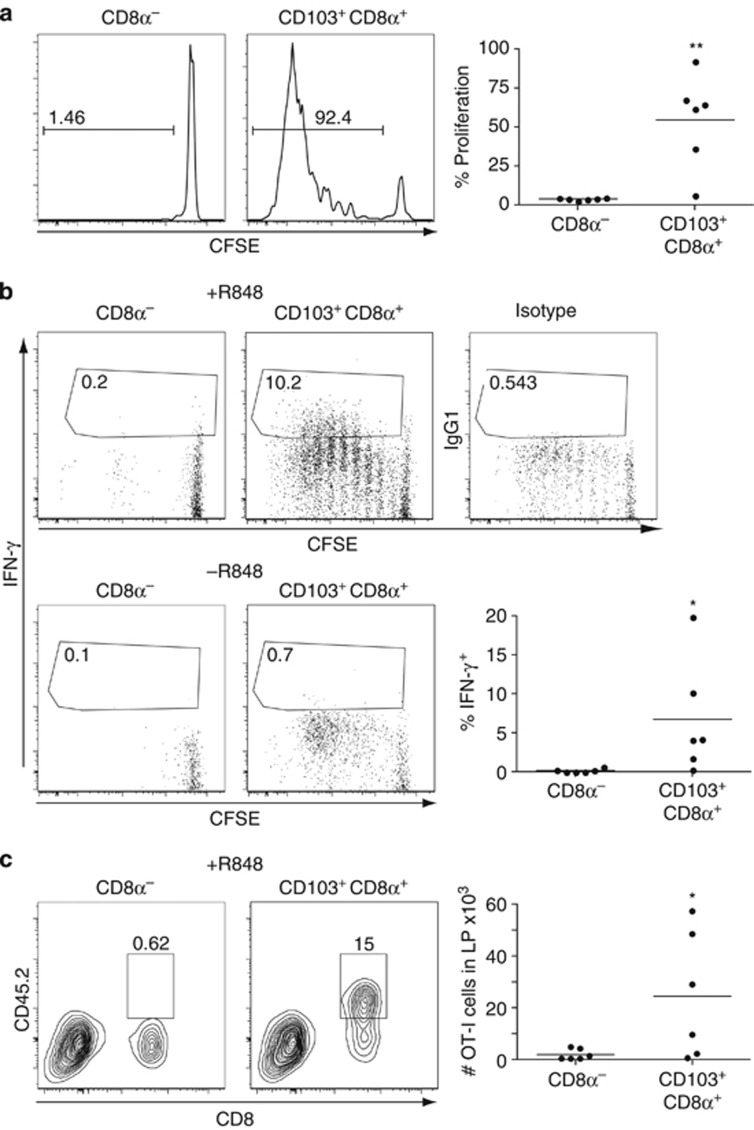
Cross-presentation of cellular antigens is crucial for priming CD8(+) T cells, and generating immunity to intracellular pathogens--particularly viruses. It is unclear which intestinal phagocytes perform this function in vivo. To address this, we examined dendritic cells (DCs) from the intestinal lymph of IFABP-tOVA 232-4 mice, which express ovalbumin in small intestinal epithelial cells (IECs). Among lymph DCs (LDCs) only CD103(+) CD11b(-) CD8α(+) DCs cross-present IEC-derived ovalbumin to CD8(+) OT-I T cells. Similarly, in the mesenteric lymph nodes (MLNs), cross-presentation of IEC-ovalbumin was limited to the CD11c(+) MHCII(hi) CD8α(+) migratory DCs, but absent from all other subsets, including the resident CD8α(hi) DCs. Crucially, delivery of purified CD8α(+) LDCs, but not other LDC subsets, into the MLN subcapsular lymphatic sinus induced proliferation of ovalbumin-specific, gut-tropic CD8(+) T cells in vivo. Finally, in 232-4 mice treated with R848, CD8α(+) LDCs were uniquely able to cross-prime interferon γ-producing CD8(+) T cells and drive their migration to the intestine. Our results clearly demonstrate that migrating CD8α(+) intestinal DCs are indispensable for cross-presentation of cellular antigens and, in conditions of inflammation, for the initial differentiation of effector CD8(+) T cells. They may therefore represent an important target for the development of antiviral vaccinations.


Figures

Figure 1
Figure 1
Stimulation with R848 after transfer of OT-I cells into IFABP-tOVA 232-4 (232-4) mice causes intestinal inflammation. 232-4 mice were injected intravenously with 5 × 10⁶ CD45.1+ OT-I cells, and a day later received R848 or phosphate-buffered saline intraperitoneally. (a) The mice were weighed daily, shown here as percentage of starting weight. Each point represents the mean of five biological replicates. (b) On day 5, cells from the small intestinal lamina propria were stained for flow cytometry, and the number of CD45.1+ OT-I cells determined. (c) Sections of small intestine from mice injected with OT-I cells, OT-I cells and R848, or with saline alone, were stained with hematoxylin and eosin to observe the pathology. (d) The mean villus length in the jejunum was calculated after measuring at least 50 villi from each animal. (e) Serum samples were obtained 5 days after R848 administration, and the levels of serum IFN-γ were determined by ELISA. In all panels asterisks denote statistical significance (*P<0.05, **P<0.01). ELISA, enzyme-linked immunosorbent assay; IFN-γ, interferon γ.
Figure 2
Figure 2
Intestinal epithelial-cell-expressed ovalbumin is cross-presented by migrating CD103+ CD11b lymph dendritic cells (LDCs). Thoracic duct cannulation was performed on 12-week-old mesenteric lymphadenectomized (MLNx) C57Bl6 or IFABP-tOVA 232-4 (232-4) mice and lymph collected for 16 h, on ice. Lymph cell populations were purified with fluorescence-activated cell sorting as shown in a. (b) 12,500 C57Bl6 LDCs of the indicated subsets were pulsed with ovalbumin, then extensively washed. DCs were then co-cultured with 105 carboxyfluorescein succinimidyl ester (CFSE)-labeled CD8+ CD62L+ OT-I cells for 3 days. Histograms represent proliferation as assessed by CFSE dilution. (c,d) 232-4 LDC subsets were plated out without the addition of soluble ovalbumin. The DCs' capacity to drive CD8+ T-cell proliferation was then assessed as above. (c) Histograms represent proliferation as assessed by CFSE dilution. (d) The graph shows the mean percentage of divided T cells; each dot represents an independent experiment. Asterisks denote statistical significance (**P<0.01). MHC II, major histocompatibility complex class II molecules.
Figure 3
Figure 3
Intestinal epithelial-cell-expressed ovalbumin is cross-presented by migrating CD103+ CD11b mesenteric lymph node dendritic cells (MLN DCs). (a) Single-cell suspensions of IFABP-tOVA 232-4 mice MLNs were stained for flow cytometry and DC subsets were purified with fluorescence-activated cell sorting as shown. (b) Levels of CD8α expression were assessed on MLN migratory CD103+ CD11b DCs (blue line) and MLN-resident CD11b DCs (red line). The shaded histogram shows staining of the total MLN DC population with the isotype control antibody. (c,d) 12,500 MLN DCs of the indicated subsets were assessed for their capacity to drive OT-I T-cell proliferation. (c) Histograms represent proliferation as assessed by carboxyfluorescein succinimidyl ester dilution. (d) The graph shows the mean percentage of divided T cells; each dot represents an independent experiment. (e) Cytospins of MLN DC subsets purified as in a were stained with a pan-cytokeratin antibody (green) and DAPI (blue). The images show examples of cytokeratin+ inclusions within the CD103+ CD11b migratory MLN DCs. The images show fluorescent signal overlaid on white light images. Bar=10 μm. (f) The graph shows the mean percentage of cells of the indicated DC subsets containing visible cytokeratin+ cytoplasmic inclusions. In all panels asterisks denote statistical significance (*P<0.05, **P<0.01). MHC II, major histocompatibility complex class II molecules.
Figure 4
Figure 4
Characteristics of intestinal lymph CD8α+ dendritic cells (DCs). (a) Thoracic duct lymph cells from mesenteric lymphadenectomized (MLNx) C57Bl6 mice were stained for flow cytometry with phenotypic markers: MerTK, CD64, CD14, CD26, CD24, CD272, CD8α, XCR1, DNGR-1 (Clec-9a), and CD172a. Each plot shows staining of the four lymph DC (LDC) subsets and is representative of at least three independent replicates. The shaded histograms show staining of the total LDC population with the isotype control antibody. (b) Thoracic duct lymph was collected from MLNx Batf3−/− mice, and lymph cells were stained for flow cytometry. Dot plots show staining of LDC subsets. The graph shows the proportion of the CD103+ CD11b DC subset as a percentage of total LDCs. Each dot represents an independent replicate. (c) LDC subsets were purified with fluorescence-activated cell sorting, the RNA extracted and reverse transcribed into cDNA. Expression of the IRF-8 mRNA was assessed by quantitative PCR. Results presented in arbitrary units (AU), normalized to the housekeeping gene cyclophilin A. In all panels asterisks denote statistical significance (*P<0.05, ***P<0.001).
Figure 5
Figure 5
Only intestinal lymph CD103+ CD11b CD8α+ dendritic cells (DCs) cross-present intestinal epithelial cell antigen in vivo. (a) Schematic shows the experimental protocol. Five days after subcapsular injections of 50,000 fluorescence-activated cell sorting (FACS) purified lymph DC (LDC) subsets, mesenteric lymph nodes (MLNs) and the small intestine (SI) were harvested from recipient mice. Cells were then stained for flow cytometry. Transferred OT-I T cells were identified as CD8+ CD45.1+ TCR Vα2+ in the MLNs (b) or SI lamina propria (LP) (c), and assessed for proliferation by carboxyfluorescein succinimidyl ester (CFSE) dilution. (b) For each injected LDC subset, FACS plots show the relative proportion of transferred OT-I T cells (CD45.1+ CD8+) among TCRVα2+ cells (top left), CFSE dilution (top right), and CCR9 expression (bottom left) in the MLNs. The graph shows mean percentage of divided T cells; each dot represents an independent experiment. Asterisks denote statistical significance (**P<0.01). (c) FACS plots show the relative proportion of transferred OT-I T cells among TCR Vα2+ cells (left) or CFSE dilution and CCR9 expression of transferred OT-I cells (right) in the LP, and are representative of two independent experiments. i.v., intravenous.
Figure 6
Figure 6
Activated intestinal lymph CD8α+ dendritic cells (DCs) cross-prime effector CD8+ T cells. CD45.1+ C57Bl6 mice received 5 × 10⁶ carboxyfluorescein succinimidyl ester (CFSE)-labeled CD45.2+ OT-I cells intravenously and, a day later, a subcapsular mesenteric lymph node (MLN) injection of 50,000 CD103+ CD8α+ or CD8α lymph DCs (LDCs) isolated from R848-treated IFABP-tOVA 232-4 mice. Three days later, MLNs and small intestine (SI) were removed and analyzed by flow cytometry. Transferred T cells were identified as CD8+ CD45.2+ TCR Vα2+. (a) Histograms show the CFSE dilution of transferred OT-I cells in the MLNs following subcapsular transfer of the indicated LDC subsets. The graph shows the mean percentage of divided cells. (b) Dot plots show representative staining for intracellular interferon γ (IFN-γ) on donor OT-I cells in the MLNs. The graph shows the mean percentage of IFN-γ+ cells among transferred OT-I cells. (c) FACS plots show the proportion of transferred OT-I T cells (CD45.2+ CD8+) among TCRVα2+ cells in the SI lamina propria (LP). The graph shows the mean number of transferred cells in the SI LP. In all graphs, each dot represents an independent biological replicate, and asterisks denote statistical significance (*P<0.05, **P<0.01).

References

    1. Haan den J.M., Lehar S.M., Bevan M.J. CD8(+) but not CD8(−) dendritic cells cross-prime cytotoxic T cells in vivo. J. Exp. Med. 2000;192:1685–1696. - PMC - PubMed
    1. Iyoda T., et al. The CD8+ dendritic cell subset selectively endocytoses dying cells in culture and in vivo. J. Exp. Med. 2002;195:1289–1302. - PMC - PubMed
    1. Bonifaz L., Bonnyay D., Mahnke K., Rivera M., Nussenzweig M.C., Steinman R.M. Efficient targeting of protein antigen to the dendritic cell receptor DEC-205 in the steady state leads to antigen presentation on major histocompatibility complex class I products and peripheral CD8+ T cell tolerance. J. Exp. Med. 2002;196:1627–1638. - PMC - PubMed
    1. Bonifaz L.C., et al. In vivo targeting of antigens to maturing dendritic cells via the DEC-205 receptor improves T cell vaccination. J. Exp. Med. 2004;199:815–824. - PMC - PubMed
    1. Allan R.S., et al. Migratory dendritic cells transfer antigen to a lymph node-resident dendritic cell population for efficient CTL priming. Immunity. 2006;25:153–162. - PubMed

Publication types

MeSH terms