. 2014 Aug;88(16):8743-53.
doi: 10.1128/JVI.01000-14. Epub 2014 May 21.

A single amino acid in EBNA-2 determines superior B lymphoblastoid cell line growth maintenance by Epstein-Barr virus type 1 EBNA-2

Affiliations

A single amino acid in EBNA-2 determines superior B lymphoblastoid cell line growth maintenance by Epstein-Barr virus type 1 EBNA-2

Stelios Tzellos et al. J Virol. 2014 Aug.

Abstract

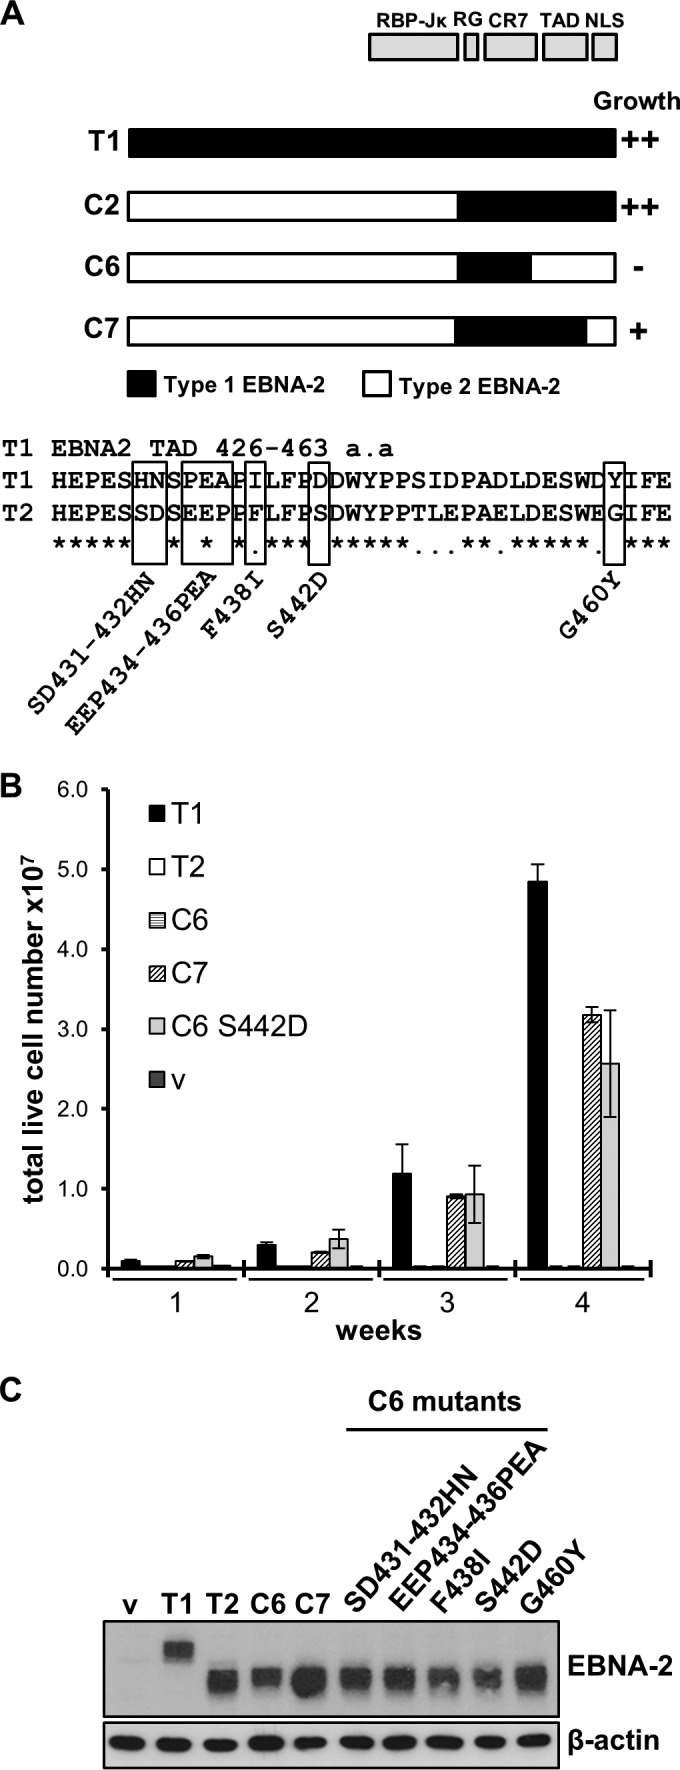
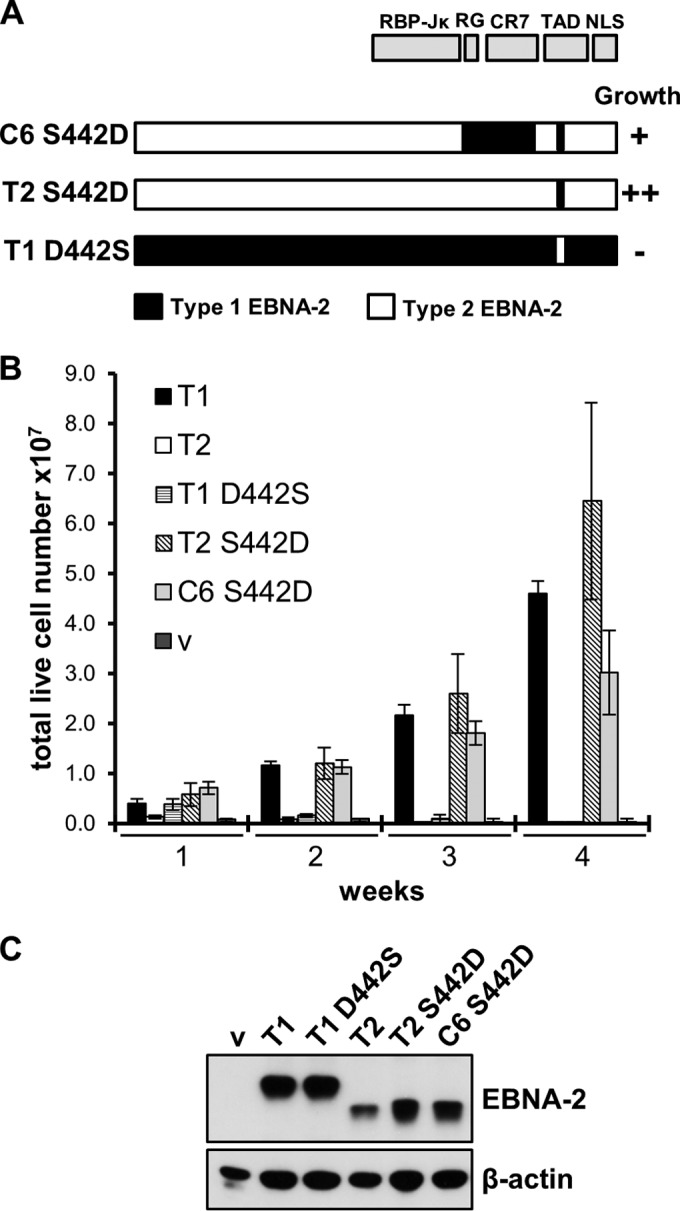
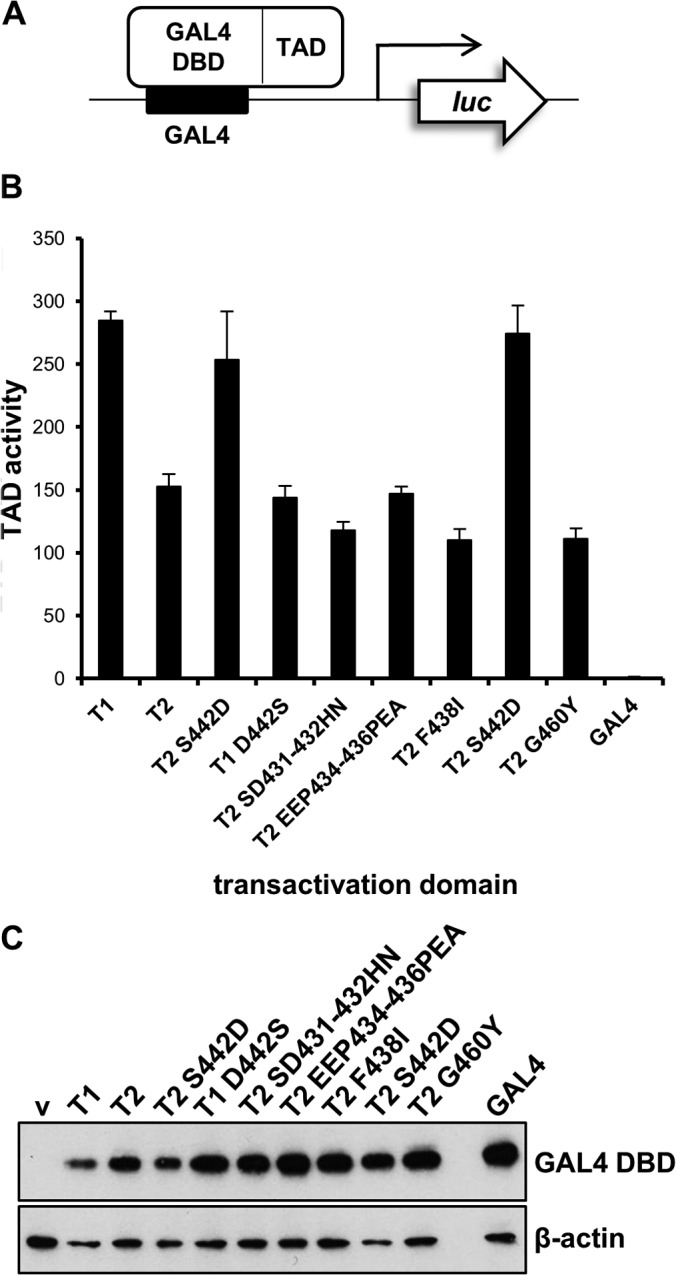
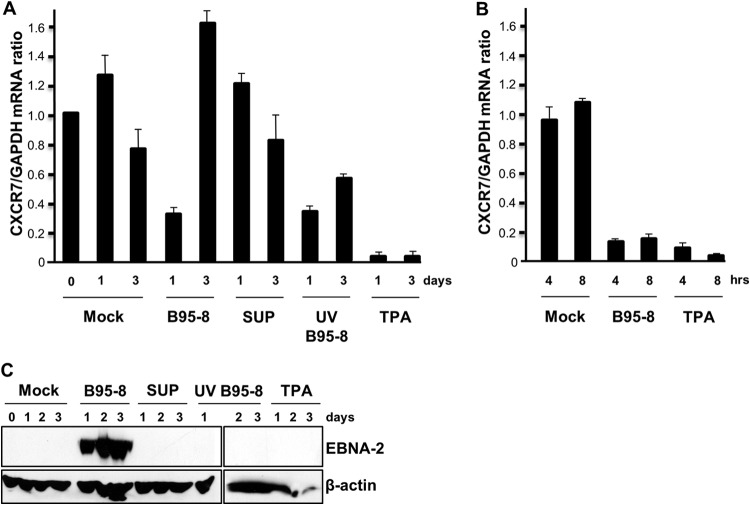
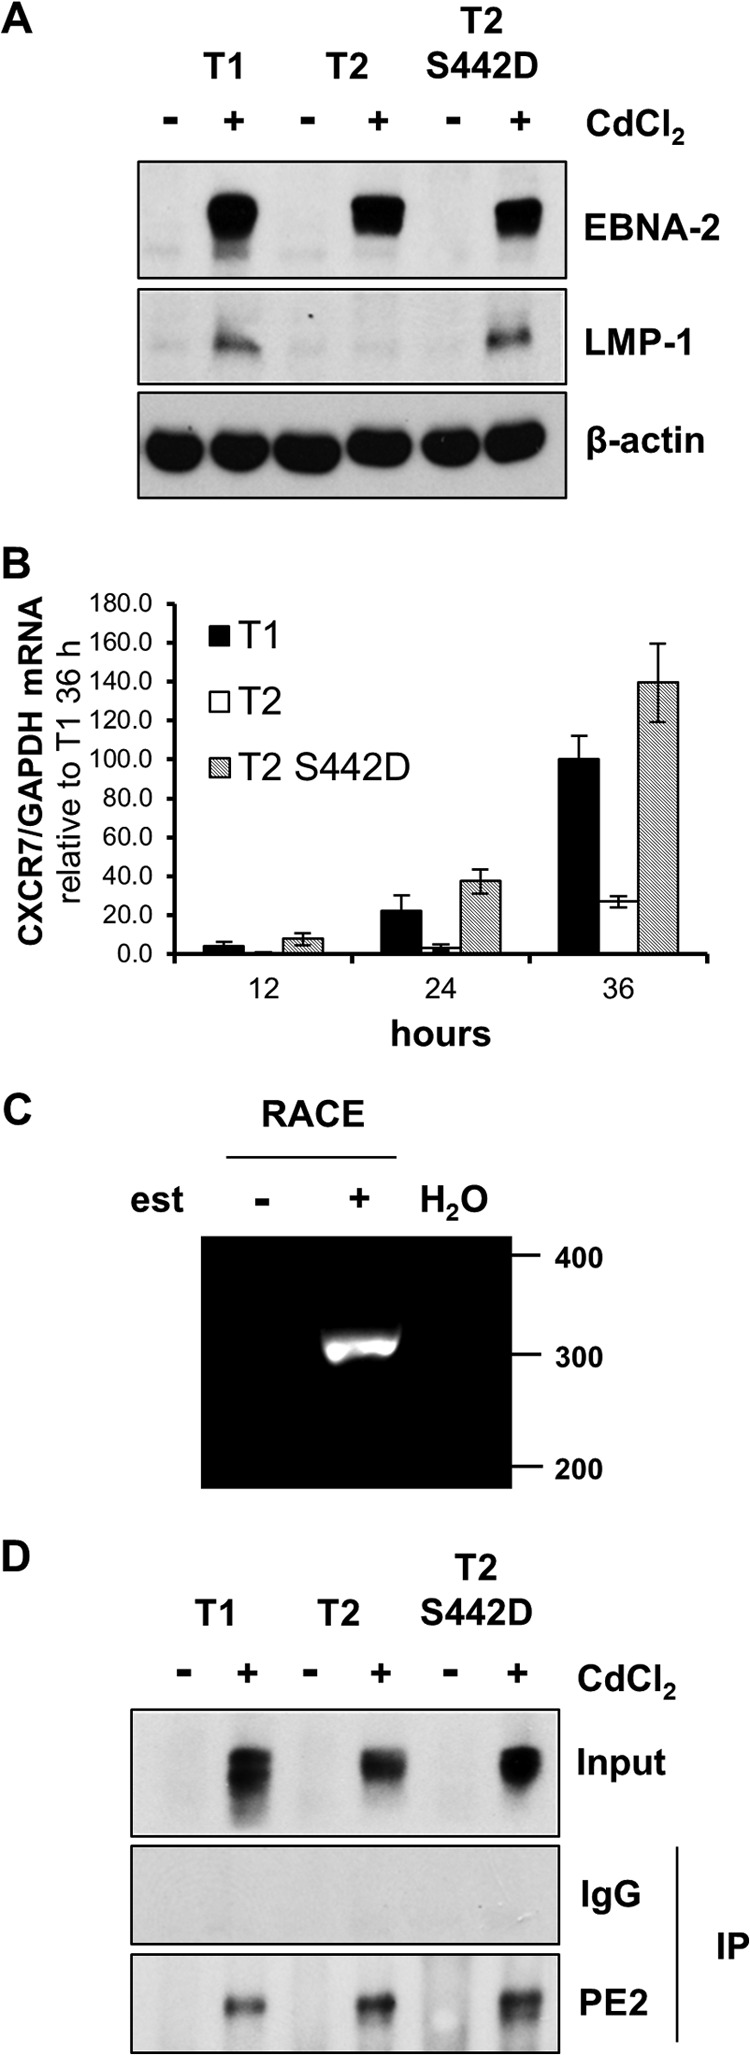
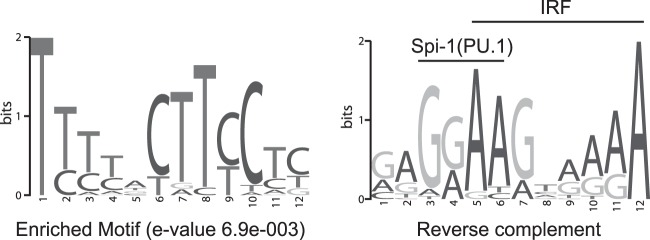
Sequence differences in the EBNA-2 protein mediate the superior ability of type 1 Epstein-Barr virus (EBV) to transform human B cells into lymphoblastoid cell lines compared to that of type 2 EBV. Here we show that changing a single amino acid (S442D) from serine in type 2 EBNA-2 to the aspartate found in type 1 EBNA-2 confers a type 1 growth phenotype in a lymphoblastoid cell line growth maintenance assay. This amino acid lies in the transactivation domain of EBNA-2, and the S442D change increases activity in a transactivation domain assay. The superior growth properties of type 1 EBNA-2 correlate with the greater induction of EBV LMP-1 and about 10 cell genes, including CXCR7. In chromatin immunoprecipitation assays, type 1 EBNA-2 is shown to associate more strongly with EBNA-2 binding sites near the LMP-1 and CXCR7 genes. Unbiased motif searching of the EBNA-2 binding regions of the differentially regulated cell genes identified an ETS-interferon regulatory factor composite element motif that closely corresponds to the sequences known to mediate EBNA-2 regulation of the LMP-1 promoter. It appears that the superior induction by type 1 EBNA-2 of the cell genes contributing to cell growth is due to their being regulated in a manner different from that for most EBNA-2-responsive genes and in a way similar to that for the LMP-1 gene.

Importance: The EBNA-2 transcription factor plays a key role in B cell transformation by EBV and defines the two EBV types. Here we identify a single amino acid (Ser in type 1 EBV, Asp in type 2 EBV) of EBNA-2 that determines the superior ability of type 1 EBNA-2 to induce a key group of cell genes and the EBV LMP-1 gene, which mediate the growth advantage of B cells infected with type 1 EBV. The EBNA-2 binding sites in these cell genes have a sequence motif similar to the sequence known to mediate regulation of the EBV LMP-1 promoter. Further detailed analysis of transactivation and promoter binding provides new insight into the physiological regulation of cell genes by EBNA-2.


Figures

FIG 1
FIG 1
S442D in the EBNA-2 chimera C6 background complements the deficiency of type 2 EBNA-2 in the EREB2.5 growth assay. (A) Growth phenotypes of EBNA-2 chimeras in the EREB2.5 growth assay from previous results (12) are shown for reference. The positions of the RBP-Jκ association, RG, CR7, nuclear localization signal (NLS), and TAD domains of EBNA-2 are indicated. The protein sequence of the TAD is shown below for type 1 EBNA-2 and type 2 EBNA-2. The five mutations indicated were made separately in EBNA-2 chimera C6. a.a, amino acids. (B) Live cell counts for the EREB2.5 growth assay with the S442D EBNA-2 chimera C6 mutant compared to those with chimeras C6 and C7. The averages of the data from at least 4 experiments, each with duplicate transfections, are shown; error bars indicate standard deviations. The other mutants tested, SD431-432HN, EEP434-436PEA, F438I, and G460Y, in EBNA-2 chimera C6 gave no cell growth in this assay (data not shown). (C) Western blot of protein extracts from EREB2.5 cells transfected with type 1 (T1), type 2 (T2), chimera C6 and C7, and C6 mutant EBNA-2 proteins. Cells were harvested 5 days after transfection, and proteins were extracted by radioimmunoprecipitation assay lysis. Type 1 EBNA-2 migrates at 85 kDa, and type 2 EBNA-2 migrates at 75 kDa. β-Actin was monitored as a loading control. v, empty vector.
FIG 2
FIG 2
S442D in type 2 EBNA-2 is sufficient to sustain LCL proliferation in the EREB2.5 assay. (A) Cartoon similar to that in Fig. 1A showing the structures of type 2 S442D EBNA-2 and type 1 D442S EBNA-2. (B) Cell counts, determined as described in the legend to Fig. 1B, for the EREB2.5 cell growth assay of the indicated plasmids expressing wild-type type 1, type 2, type 1 D442S, type 2 S442D, and C6 S442D EBNA-2 and an empty vector (v) 1 to 4 weeks after transfection. (C) Western blot analysis of protein extracts from EREB2.5 cells transfected with the indicated EBNA-2 expression plasmids, as described in the legend to Fig. 1C.
FIG 3
FIG 3
Transactivation domain reporter assay for EBNA-2 mutants. (A) Representation of transactivation domain assay. A firefly luciferase reporter gene can be activated by the GAL4 DBD–EBNA-2 TAD fusion protein being tested. GAL4 DBD binds to GAL4 binding sites in the luciferase reporter plasmid promoter. (B) Transactivation domain assay of EBNA-2 TAD and mutants in BJAB cells 24 h after transfection. TAD and luciferase activity is given relative to that for the empty vector (GAL4) after normalizing for transfection efficiency with a cotransfected Renilla luciferase plasmid. Two independently derived type 2 S442D EBNA-2 TAD plasmids used in this assay are shown. Results are depicted as the means ± standard deviations from 3 independent experiments. (C) Western blot of HEK293 cells transfected with pcDNA3.1-GAL4 DBD plasmids expressing the different TAD fusions. Protein extracts were analyzed by Western blotting using the GAL4 DBD antibody, and β-actin was used as a loading control.
FIG 4
FIG 4
CXCR7 mRNA is rapidly degraded upon EBV infection and is then reinduced by EBNA-2. (A) Primary B cells were infected with type 1 B95-8 EBV or with UV-inactivated B95-8 EBV (UV B95-8). Separate primary B cell samples were exposed to the supernatant remaining after pelleting of EBV by ultracentrifugation (SUP) or were treated with tetradecanoyl phorbol acetate (TPA). RNA was extracted after 1 or 3 days, cDNA was prepared, and qPCR was performed for CXCR7. The CXCR7 mRNA level normalized to that of GAPDH mRNA is shown relative to the value for mock infection on day 0. Error bars represent standard deviations from at least 3 independent experiments. (B) Primary B cells were infected with B95-8 EBV or treated with TPA as described in the legend to panel A but analyzed for CXCR7 mRNA after 4 or 8 h. (C) Protein extracts from the experiment whose results are shown in panel A were tested for EBNA-2 by immunoblotting (with β-actin as a loading control). We showed previously that EBNA-2 protein expression is first detected between 12 and 16 h after infection (35).
FIG 5
FIG 5
Differential induction of LMP-1 and CXCR7 in Daudi cells with inducible type 1, type 2, or type 2 S442D EBNA-2. (A) Daudi cell lines stably transfected with pHEBoMT plasmids expressing type 1 (T1), type 2 (T2), or type 2 S442D (T2 S442D) EBNA-2 were induced (+) with cadmium chloride (CdCl2) for 24 h or left uninduced (−). Protein samples were analyzed by immunoblotting for EBNA-2, LMP-1, and β-actin (as a loading control). The EBNA-2 polyproline repeat region was equalized in these EBNA-2 plasmids so that all the EBNA-2 proteins were about 75 kDa in these cell lines. (B) The type 1, type 2, and type 2 S442D EBNA-2-expressing cell lines were treated with CdCl2, and total cell RNA was extracted after 12, 24, and 36 h. RNA was converted to cDNA and analyzed by qPCR to quantify CXCR7 mRNA levels. The histograms show the CXCR7 mRNA/GAPDH mRNA ratio normalized to the value for type 1 EBNA-2 at 36 h, which was set equal to 100. Error bars represent standard deviations from at least 3 experiments. (C) 5′ RACE was performed using EREB2.5 cells treated (+) or untreated (−) with β-estradiol (est) in the culture medium. Water (H2O) was used as a negative control for the PCR in the experiment. The single RACE product migrated at about 300 bp on an agarose gel stained with ethidium bromide. (D) Immunoblotting control for the ChIP experiment whose results are shown in Fig. 6. Daudi cell lines were induced (+) with CdCl2 for 24 h or left uninduced (−). Nuclear extracts were prepared, and EBNA-2 ChIP was performed using the PE2 antibody. An unrelated mouse monoclonal IgG antibody was used as a negative control in the ChIP. ChIP samples were then immunoblotted for EBNA-2 (PE2 antibody) to check for approximately equal precipitation of EBNA-2. IP, immunoprecipitation.
FIG 6
FIG 6
EBNA-2 ChIP binding at CXCR7, LMP-1, and CCL3 promoter elements. (A) ChIP-seq data for type 1 EBNA-2 binding sites at the CXCR7 gene locus in an LCL (GM12878) and in the Mutu III BL cell line using methods described previously (11). The 5′ RACE experiment showed the middle CXCR7 isoform (highlighted) to be the CXCR7 RNA induced by EBNA-2. The y axis displays the number of sequence reads per million background-subtracted reads. Filled boxes, significant peaks of EBNA-2 binding (MACS, <10−7) in Mutu III cells (numbered 1 to 17 from left to right); asterisks, MACS peak locations of the motifs identified by MEME-ChIP that contribute to the EICE consensus (Table 1); chr2, chromosome 2. (B to E) ChIP-qPCR was carried out on nuclei from cells for which the results are shown in Fig. 5D using primers specific to regions known to be bound and not bound by type 1 EBNA-2 in ChIP-seq for which the results are shown in panel A. (B) CXCR7 peak 16 gene locus; (C) CXCR7 peak 13 gene locus; (D) LMP-1 gene locus; (E) CCL3 gene locus. qPCR values for EBNA-2 ChIP (PE2) and the IgG control are given relative to the ChIP input (in percent). Results are shown as the means ± standard deviations from 3 independent ChIP experiments. ns, not significant; **, P < 0.01; ***, P < 0.005.
FIG 7
FIG 7
Enriched motif generated by MEME-ChIP analysis of EBNA-2 binding sites at nine differentially regulated cell genes and the EBV LMP-1 promoter shown in standard form (left) and as the reverse complement (right). The vertical scale in bits represents the relative frequency of each base as a fraction of 2. The overlapping PU.1 and IRF motifs that constitute an EICE are indicated. Details of the matching sites are shown in Table 1.

Similar articles

Cited by

References

    1. Tsai MH, Raykova A, Klinke O, Bernhardt K, Gartner K, Leung CS, Geletneky K, Sertel S, Munz C, Feederle R, Delecluse HJ. 2013. Spontaneous lytic replication and epitheliotropism define an Epstein-Barr virus strain found in carcinomas. Cell Rep. 5:458–470. 10.1016/j.celrep.2013.09.012 - DOI - PubMed
    1. White RE, Ramer PC, Naresh KN, Meixlsperger S, Pinaud L, Rooney C, Savoldo B, Coutinho R, Bodor C, Gribben J, Ibrahim HA, Bower M, Nourse JP, Gandhi MK, Middeldorp J, Cader FZ, Murray P, Munz C, Allday MJ. 2012. EBNA3B-deficient EBV promotes B cell lymphomagenesis in humanized mice and is found in human tumors. J. Clin. Invest. 122:1487–1502. 10.1172/JCI58092 - DOI - PMC - PubMed
    1. Kieff E, Rickinson A. 2007. Epstein-Barr virus, p 2603–2654 In Knipe DM, Howley PM, Griffin DE, Lamb RA, Martin MA, Roizman B, Straus SE. (ed), Fields virology, 5th ed. Lippincott Williams & Wilkins, Philadelphia, PA
    1. Tzellos S, Farrell PJ. 2012. Epstein-Barr virus sequence variation—biology and disease. Pathogens 1:156–174. 10.3390/pathogens1020156 - DOI - PMC - PubMed
    1. Rickinson AB, Young LS, Rowe M. 1987. Influence of the Epstein-Barr virus nuclear antigen EBNA 2 on the growth phenotype of virus-transformed B cells. J. Virol. 61:1310–1317 - PMC - PubMed

Publication types

MeSH terms