Genome properties and prospects of genomic prediction of hybrid performance in a breeding program of maize
- PMID: 24850820
- PMCID: PMC4125404
- DOI: 10.1534/genetics.114.165860
Genome properties and prospects of genomic prediction of hybrid performance in a breeding program of maize
Abstract
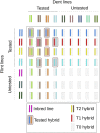
Maize (Zea mays L.) serves as model plant for heterosis research and is the crop where hybrid breeding was pioneered. We analyzed genomic and phenotypic data of 1254 hybrids of a typical maize hybrid breeding program based on the important Dent × Flint heterotic pattern. Our main objectives were to investigate genome properties of the parental lines (e.g., allele frequencies, linkage disequilibrium, and phases) and examine the prospects of genomic prediction of hybrid performance. We found high consistency of linkage phases and large differences in allele frequencies between the Dent and Flint heterotic groups in pericentromeric regions. These results can be explained by the Hill-Robertson effect and support the hypothesis of differential fixation of alleles due to pseudo-overdominance in these regions. In pericentromeric regions we also found indications for consistent marker-QTL linkage between heterotic groups. With prediction methods GBLUP and BayesB, the cross-validation prediction accuracy ranged from 0.75 to 0.92 for grain yield and from 0.59 to 0.95 for grain moisture. The prediction accuracy of untested hybrids was highest, if both parents were parents of other hybrids in the training set, and lowest, if none of them were involved in any training set hybrid. Optimizing the composition of the training set in terms of number of lines and hybrids per line could further increase prediction accuracy. We conclude that genomic prediction facilitates a paradigm shift in hybrid breeding by focusing on the performance of experimental hybrids rather than the performance of parental lines in test crosses.
Keywords: GenPred, shared data resources; genomic prediction; heterotic groups; hybrid breeding; linkage phases; training set design.
Copyright © 2014 by the Genetics Society of America.
Figures


References
-
- Albrecht T., Wimmer V., Auinger H.-J., Erbe M., Knaak C., et al. , 2011. Genome-based prediction of testcross values in maize. Theor. Appl. Genet. 123: 339–350. - PubMed
-
- Asoro F. G., Newell M. A., Beavis W. D., Scott M. P., Jannink J.-L., 2011. Accuracy and training population design for genomic selection on quantitative traits in elite North American oats. Plant Genome 4: 132–144.
-
- Bernardo R., 1996. Best linear unbiased prediction of maize single-cross performance. Crop Sci. 36: 50–56. - PubMed
Publication types
MeSH terms
Substances
LinkOut - more resources
Full Text Sources
Other Literature Sources

