

Decreased Nucleotide and Expression Diversity and Modified Coexpression Patterns Characterize Domestication in the Common Bean
- PMID: 24850850
- PMCID: PMC4079357
- DOI: 10.1105/tpc.114.124040
Decreased Nucleotide and Expression Diversity and Modified Coexpression Patterns Characterize Domestication in the Common Bean
Abstract
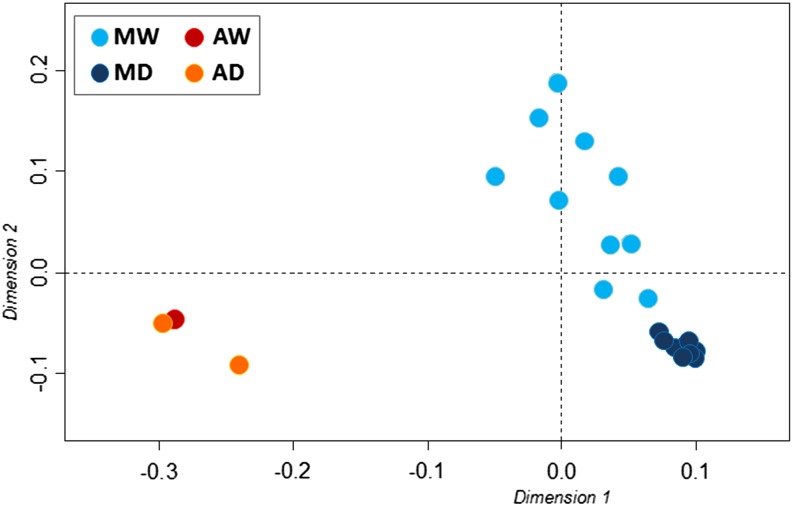
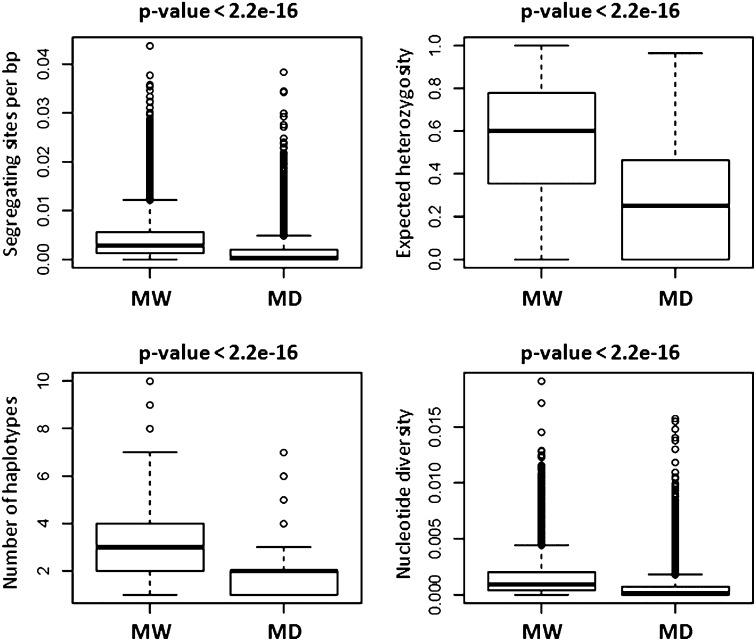
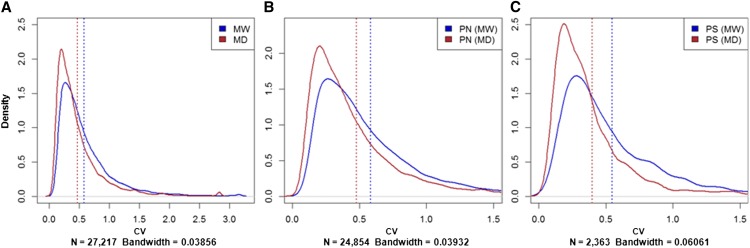
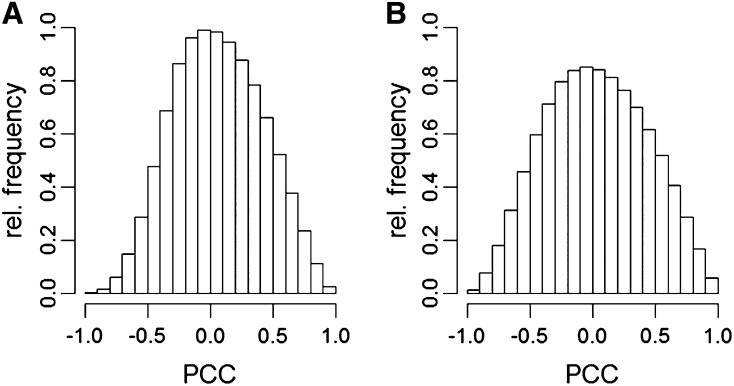
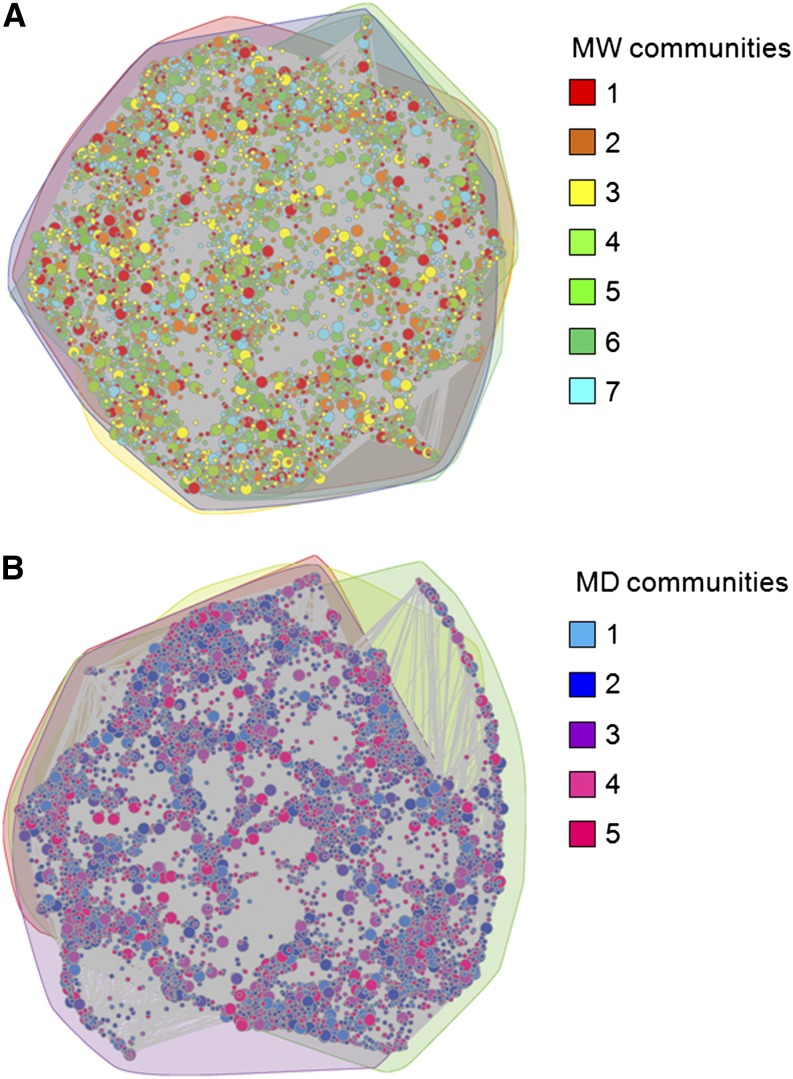
Using RNA sequencing technology and de novo transcriptome assembly, we compared representative sets of wild and domesticated accessions of common bean (Phaseolus vulgaris) from Mesoamerica. RNA was extracted at the first true-leaf stage, and de novo assembly was used to develop a reference transcriptome; the final data set consists of ∼190,000 single nucleotide polymorphisms from 27,243 contigs in expressed genomic regions. A drastic reduction in nucleotide diversity (∼60%) is evident for the domesticated form, compared with the wild form, and almost 50% of the contigs that are polymorphic were brought to fixation by domestication. In parallel, the effects of domestication decreased the diversity of gene expression (18%). While the coexpression networks for the wild and domesticated accessions demonstrate similar seminal network properties, they show distinct community structures that are enriched for different molecular functions. After simulating the demographic dynamics during domestication, we found that 9% of the genes were actively selected during domestication. We also show that selection induced a further reduction in the diversity of gene expression (26%) and was associated with 5-fold enrichment of differentially expressed genes. While there is substantial evidence of positive selection associated with domestication, in a few cases, this selection has increased the nucleotide diversity in the domesticated pool at target loci associated with abiotic stress responses, flowering time, and morphology.
© 2014 American Society of Plant Biologists. All rights reserved.
Figures
Similar articles
-
Molecular analysis of the parallel domestication of the common bean (Phaseolus vulgaris) in Mesoamerica and the Andes.New Phytol. 2013 Jan;197(1):300-313. doi: 10.1111/j.1469-8137.2012.04377.x. Epub 2012 Nov 5. New Phytol. 2013. PMID: 23126683
-
High Level of Nonsynonymous Changes in Common Bean Suggests That Selection under Domestication Increased Functional Diversity at Target Traits.Front Plant Sci. 2017 Jan 6;7:2005. doi: 10.3389/fpls.2016.02005. eCollection 2016. Front Plant Sci. 2017. PMID: 28111584 Free PMC article.
-
Landscape genetics, adaptive diversity and population structure in Phaseolus vulgaris.New Phytol. 2016 Mar;209(4):1781-94. doi: 10.1111/nph.13713. Epub 2015 Nov 3. New Phytol. 2016. PMID: 26526745
-
The Road to Sorghum Domestication: Evidence From Nucleotide Diversity and Gene Expression Patterns.Front Plant Sci. 2021 Aug 30;12:666075. doi: 10.3389/fpls.2021.666075. eCollection 2021. Front Plant Sci. 2021. PMID: 34527004 Free PMC article.
-
Domestication patterns in common bean (Phaseolus vulgaris L.) and the origin of the Mesoamerican and Andean cultivated races.Theor Appl Genet. 2005 Feb;110(3):432-44. doi: 10.1007/s00122-004-1842-2. Epub 2005 Jan 18. Theor Appl Genet. 2005. PMID: 15655667
Cited by
-
Improved genome assembly and pan-genome provide key insights into eggplant domestication and breeding.Plant J. 2021 Jul;107(2):579-596. doi: 10.1111/tpj.15313. Epub 2021 Jun 5. Plant J. 2021. PMID: 33964091 Free PMC article.
-
Morphophysiological changes of wild Stachys multicaulis species under physical conditions during the cultivation process.Heliyon. 2019 Jul 18;5(7):e02093. doi: 10.1016/j.heliyon.2019.e02093. eCollection 2019 Jul. Heliyon. 2019. PMID: 31367686 Free PMC article.
-
Genomic approaches for studying crop evolution.Genome Biol. 2018 Sep 21;19(1):140. doi: 10.1186/s13059-018-1528-8. Genome Biol. 2018. PMID: 30241487 Free PMC article. Review.
-
Cis- and Trans-Regulatory Variations in the Domestication of the Chili Pepper Fruit.Mol Biol Evol. 2020 Jun 1;37(6):1593-1603. doi: 10.1093/molbev/msaa027. Mol Biol Evol. 2020. PMID: 32031611 Free PMC article.
-
Beans (Phaseolus ssp.) as a Model for Understanding Crop Evolution.Front Plant Sci. 2017 May 8;8:722. doi: 10.3389/fpls.2017.00722. eCollection 2017. Front Plant Sci. 2017. PMID: 28533789 Free PMC article. Review.
References
-
- Anders, S. (2010). HTSeq: analysing high-throughput sequencing data with Python. http://www-huber.embl.de/users/anders/HTSeq/doc/overview.html - PMC - PubMed
-
- Bauer D.F. (1972). Constructing confidence sets using rank statistics. J. Am. Stat. Assoc. 67: 687–690
-
- Benjamini Y., Hochberg Y. (1995). Controlling the false discovery rate: a practical and powerful approach to multiple testing. J. R. Stat. Soc. B 57: 289–300
Grants and funding
LinkOut - more resources
Full Text Sources
Other Literature Sources
Molecular Biology Databases
