. 2014 Jul;165(3):1076-1091.
doi: 10.1104/pp.114.240283. Epub 2014 May 21.

Evolution of the Phosphoenolpyruvate Carboxylase Protein Kinase Family in C3 and C4 Flaveria spp

Affiliations

Evolution of the Phosphoenolpyruvate Carboxylase Protein Kinase Family in C3 and C4 Flaveria spp

Sophia H Aldous et al. Plant Physiol. 2014 Jul.

Abstract

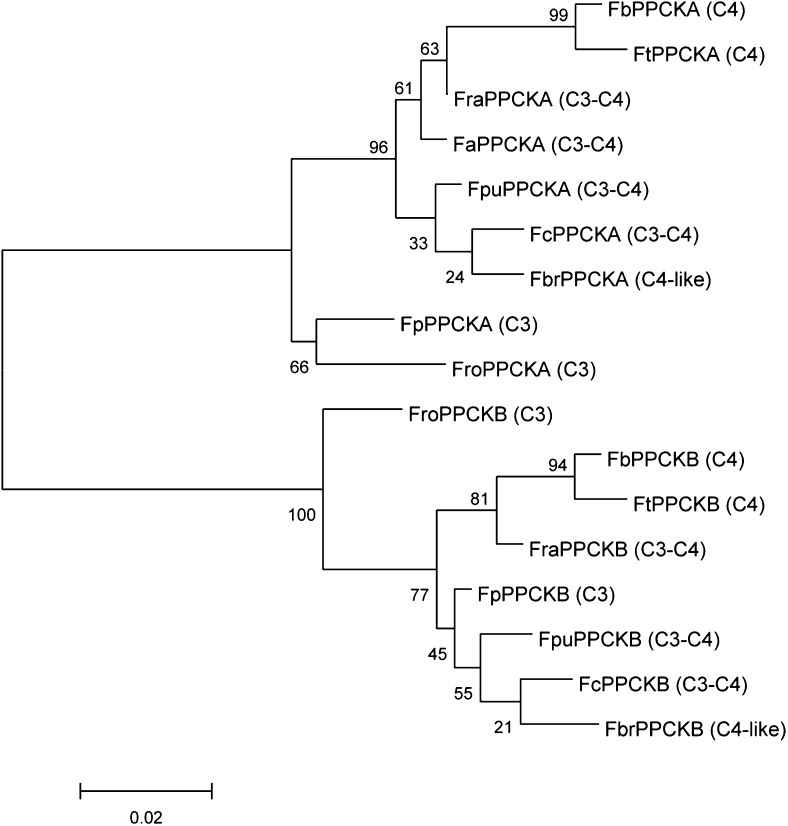
The key enzyme for C4 photosynthesis, Phosphoenolpyruvate Carboxylase (PEPC), evolved from nonphotosynthetic PEPC found in C3 ancestors. In all plants, PEPC is phosphorylated by Phosphoenolpyruvate Carboxylase Protein Kinase (PPCK). However, differences in the phosphorylation pattern exist among plants with these photosynthetic types, and it is still not clear if they are due to interspecies differences or depend on photosynthetic type. The genus Flaveria contains closely related C3, C3-C4 intermediate, and C4 species, which are evolutionarily young and thus well suited for comparative analysis. To characterize the evolutionary differences in PPCK between plants with C3 and C4 photosynthesis, transcriptome libraries from nine Flaveria spp. were used, and a two-member PPCK family (PPCKA and PPCKB) was identified. Sequence analysis identified a number of C3- and C4-specific residues with various occurrences in the intermediates. Quantitative analysis of transcriptome data revealed that PPCKA and PPCKB exhibit inverse diel expression patterns and that C3 and C4 Flaveria spp. differ in the expression levels of these genes. PPCKA has maximal expression levels during the day, whereas PPCKB has maximal expression during the night. Phosphorylation patterns of PEPC varied among C3 and C4 Flaveria spp. too, with PEPC from the C4 species being predominantly phosphorylated throughout the day, while in the C3 species the phosphorylation level was maintained during the entire 24 h. Since C4 Flaveria spp. evolved from C3 ancestors, this work links the evolutionary changes in sequence, PPCK expression, and phosphorylation pattern to an evolutionary phase shift of kinase activity from a C3 to a C4 mode.


Figures

Figure 1.
Figure 1.
Phylogenetic analysis of the PPCK family in Flaveria spp. Two PPCK isoforms, A and B, are found in each Flaveria spp. that cluster together to form individual groups. In both situations, the isoforms from the C4 species show the largest evolutionary distance from the C3 species. Species are indicated as follows: F. trinervia (Ft), F. bidentis (Fb), F. brownii (Fbr), F. ramosissima (Fra), F. anomala (Fa), F. pubescence (Fpu), F. chloraefolia (Fc), F. pringlei (Fp), and F. robusta (Fro). FaPPCKB was not used in the phylogeny due to partial sequence coverage. The photosynthesis type for each species is indicated on the phylogenetic tree. Evolutionary analyses were conducted in MEGA5 (Tamura et al., 2011; Hall, 2013). Sequences were aligned using MUSCLE (Edgar, 2004) with default settings for 1,000 iterations. The evolutionary history was inferred by using the maximum likelihood method based on the Jones-Taylor-Thornton matrix-based model (Jones et al., 1992). The tree with the highest log likelihood (−1,268.7007) is shown. The tree is drawn to scale, with branch lengths measured in the number of substitutions per site. The analysis involved 17 amino acid sequences. All positions containing gaps and missing data were eliminated. The reliability of the evolutionary relationship was estimated using bootstrap variances (1,000 replicates), indicated in percentages at the branches.
Figure 2.
Figure 2.
Amino acid exchanges between Flaveria spp. with C3 and C4 photosynthesis. A, Multiple sequence alignment of PPCK A and B isoforms from nine Flaveria spp. using MUSCLE (Edgar, 2004). B, Schematic model of PPCKA from F. pringlei, with marked positions of amino acid exchange among C3 and C4 species for both isoforms. C, Three-dimensional model of PPCKA from F. trinervia (blue) aligned onto the model from F. pringlei (red); the positions of the amino acid exchanges are marked in yellow and numbered according to the alignment shown in A. The protein kinase catalytic core domain starts at amino acid position 15 at the N terminus and ends at position 268 at the C terminus (according to BAB71853 and BAF4832). Amino acids involved in ATP binding are indicated in red, and those involved in substrate binding are marked in light blue. Amino acids in green are involved in ATP and substrate binding; dark blue boxes refer to the A-loop. Highlighted background or stars indicate amino acid residues that differ between species with C3 and C4 photosynthesis. PPCK sequences from C4 Flaveria spp. were taken from the accessions BAB71853 and BAF4832. The remaining Flaveria spp. PPCK sequences were cloned and/or obtained from RNAseq. Sequences used for the alignment and modeling are listed in Supplemental File S1. Species are indicated as follows: C4 species: F. trinervia (Ft) and F. bidentis (Fb); C4-like species: F. brownii (Fbr); C3-C4 species: F. ramosissima (Fra), F. anomala (Fa), F. pubescens (Fpu), and F. chloraefolia (Fch); and C3 species: F. pringlei (Fp) and F. robusta (Fro). The three-dimensional models are calculated using SWISS-MODEL (Schwede et al., 2003; Arnold et al., 2006; Kiefer et al., 2009) using the sequences for FtPPCKA and FpPPCKA listed in Supplemental File S1. PPCKAs from F. pringlei and F. trinervia are modeled onto a calmodulin domain protein kinase 1 from Toxoplasma gondii, with sequence similarities of 0.4 (sequence identity of 38.49%) and 0.4 (sequence identity of 39.62%), respectively. The models with highest Qualitative Model Energy Analysis values (−0.85 and −0.78 for FpPPCKA and FtPPCKA, respectively) were aligned in iPBA (de Brevern et al., 2000; Joseph et al., 2010; Benkert et al., 2011), and the resulting file was displayed in PyMol version 1.3 (http://www.pymol.org/).
Figure 3.
Figure 3.
Transcript abundances of the PPCK genes from Flaveria spp. along a light/dark cycle. Each graph represents the circadian transcript expression of PPCKA (A), normalized PPCKA (B), PPCKB (C), and normalized PPCKB (D) genes from F. pringlei (C3) and F. trinervia (C4) plants grown under light (white background) and dark (gray background) conditions, also indicated as the white (light) and black (dark) horizontal bars. The transcript abundances of PPCK genes are presented in RPMK as averages of three biological replicates measured by RNAseq. Normalized RPMK values for each time point were expressed as percentages from the sum of RPMK values for the respective time series for each transcript (B and D). F. trinervia (C4), blue lines; F. pringlei (C3), red lines; PPCKA, black circles; PPCKB, white circles. Lights were turned on at 0 h and off at 10 h diurnal time. The se was calculated for each time course of three biological replicates. Significant differences between each time point were determined with the RPMK values using a one-way ANOVA (Tukey test) and additionally by Student’s t test (P ≤ 0.05; Supplemental File S4).
Figure 4.
Figure 4.
Circadian variation of PEPC phosphorylation levels in comparison with PPCK transcripts. The ratio of PEPC phosphorylation was calculated as the ratio of the concentrations of the phosphorylated and nonphosphorylated versions of the peptide LASIDAQR monitored by SRM and is expressed as a percentage from the total sum of ratios for each species. The diel variation of PPCKA and PPCKB transcripts for each species is expressed as percentage RPMK as in Figure 3. Three biological replicates were averaged for each time point. A, F. trinervia. B, F. pringlei. PPCKA, gray lines and gray circles; PPCKB, gray lines and white circles; ratio of phosphorylated PEPC, black lines and black squares. The horizontal bars above the graphs and the graph backgrounds indicate the light conditions: light, white; dark, black/gray. The original results for each measurement are listed in Supplemental File S4.
Figure 5.
Figure 5.
In vitro phosphorylation of ppcA PEPC protein from Flaveria spp. Recombinant ppcA PEPC proteins from species with C3 and C4 photosynthesis were phosphorylated in vitro using radioactive ATP and recombinant PPCK from two Flaveria spp. PPCKs are not specific to the PEPC from the respective species and can cross phosphorylate in vitro. A, The phosphorylation of the F. pringlei ppcA PEPC (1 µg) was tested, with equal amounts of purified recombinant kinase based on Supplemental File S5: FpPPCKA (25 µg of total protein) and FtPPCKA (1 µg of total protein). B, Indications of higher activity by the PPCK from C4 species appeared only when FtPEPC (3 µg) was used as a substrate: FpPPCK (25 µg of total protein) and FtPPCK (1 µg of total protein). Each lane represents an independent PPCK expression and purification. Controls are as follows: C1, temperature-deactivated PPCK; C2, no PEPC; C3, no FpPPCK; C4, no FtPPCK.
Figure 6.
Figure 6.
Analysis of the phosphorylation motif on the N terminus of PEPC. The first 18 to 21 amino acids (based on the sequence alignment in Supplemental File S7) were analyzed for conserved motifs using the online tool MEME (http://meme.nbcr.net/meme/; Bailey and Elkan, 1994). A, The consensus motif E-K-X-X-S-I-D-A-Q-L-R was found in 50 of the 56 submitted sequences from Flaveria spp., Brassicales, Amaranthaceae, and Poaceae. Several C3-to-C4 amino acid exchanges can be observed in front of the phosphorylated Ser (Supplemental File S7). B, The consensus sequence for Flaveria shows the exchanges L6V (found in C4 ppcA PEPC) and Q15H (found in C4 ppcB PEPCs), which differ between C3 and C4 species. C, Virtual mutagenesis was applied to the crystal structure of the PEPC tetramer from F. pringlei, which starts at position Leu-6. The applied mutations L6V and Q15H lie on the surface of the molecule and are accessible to the solute. Shades of gray indicate the individual monomers as part of the PEPC tetramer; Val, cyan; Ser-11, yellow; His, green.

Similar articles

Cited by

References

    1. Agetsuma M, Furumoto T, Yanagisawa S, Izui K. (2005) The ubiquitin-proteasome pathway is involved in rapid degradation of phosphoenolpyruvate carboxylase kinase for C4 photosynthesis. Plant Cell Physiol 46: 389–398 - PubMed
    1. Akyildiz M, Gowik U, Engelmann S, Koczor M, Streubel M, Westhoff P. (2007) Evolution and function of a cis-regulatory module for mesophyll-specific gene expression in the C4 dicot Flaveria trinervia. Plant Cell 19: 3391–3402 - PMC - PubMed
    1. Arnold K, Bordoli L, Kopp J, Schwede T. (2006) The SWISS-MODEL workspace: a web-based environment for protein structure homology modelling. Bioinformatics 22: 195–201 - PubMed
    1. Arsova B, Zauber H, Schulze WX. (2012) Precision, proteome coverage, and dynamic range of Arabidopsis proteome profiling using (15)N metabolic labeling and label-free approaches. Mol Cell Proteomics 11: 619–628 - PMC - PubMed
    1. Aubry S, Brown NJ, Hibberd JM. (2011) The role of proteins in C(3) plants prior to their recruitment into the C(4) pathway. J Exp Bot 62: 3049–3059 - PubMed

LinkOut - more resources