. 2014 Sep;13(9):2426-34.
doi: 10.1074/mcp.O113.036608. Epub 2014 May 21.

Single-step enrichment by Ti4+-IMAC and label-free quantitation enables in-depth monitoring of phosphorylation dynamics with high reproducibility and temporal resolution

Affiliations

Single-step enrichment by Ti4+-IMAC and label-free quantitation enables in-depth monitoring of phosphorylation dynamics with high reproducibility and temporal resolution

Erik L de Graaf et al. Mol Cell Proteomics. 2014 Sep.

Abstract

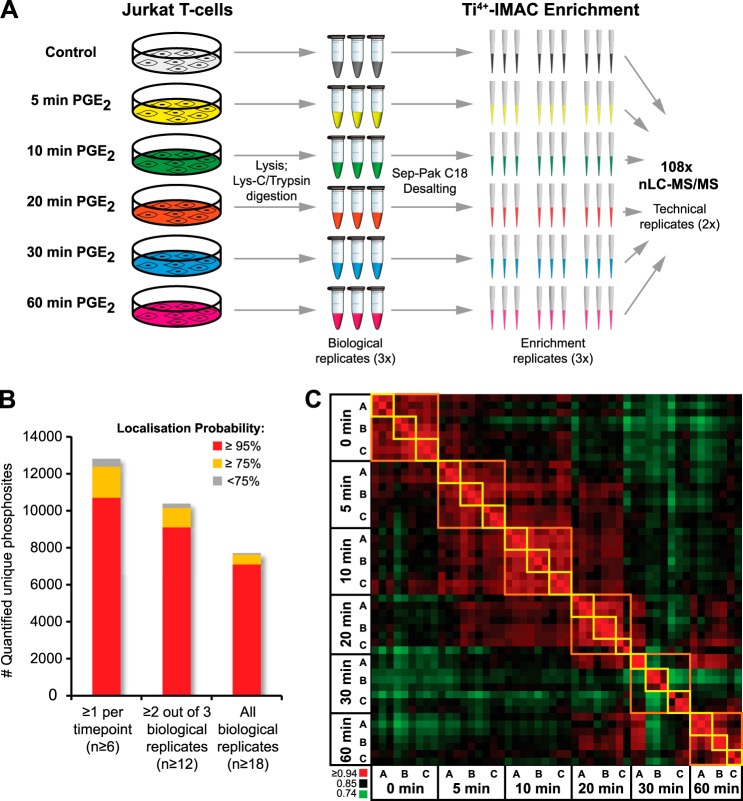
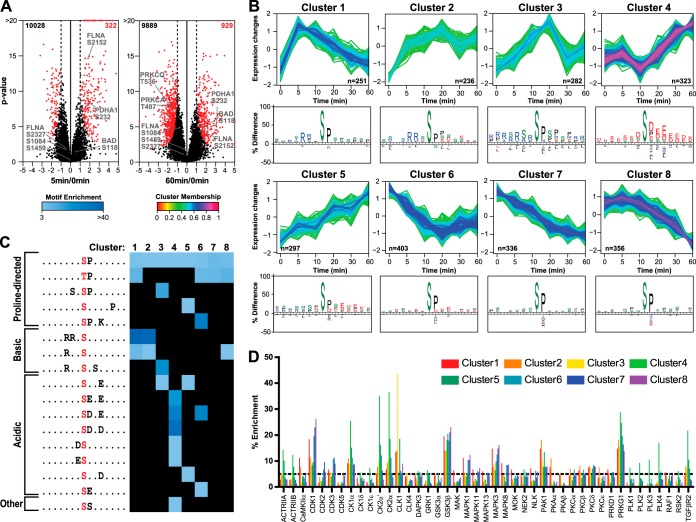
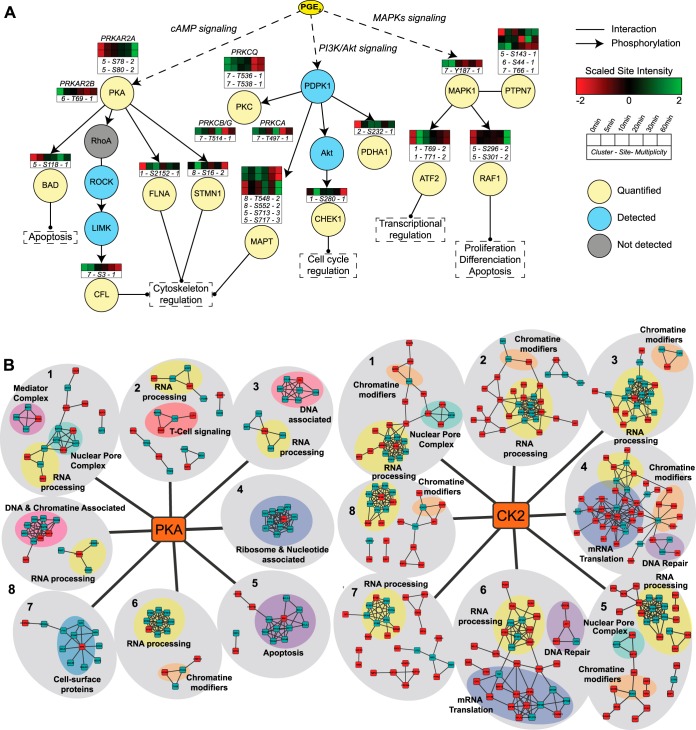
Quantitative phosphoproteomics workflows traditionally involve additional sample labeling and fractionation steps for accurate and in-depth analysis. Here we report a high-throughput, straightforward, and comprehensive label-free phosphoproteomics approach using the highly selective, reproducible, and sensitive Ti(4+)-IMAC phosphopeptide enrichment method. We demonstrate the applicability of this approach by monitoring the phosphoproteome dynamics of Jurkat T cells stimulated by prostaglandin E2 (PGE2) over six different time points, measuring in total 108 snapshots of the phosphoproteome. In total, we quantitatively monitored 12,799 unique phosphosites over all time points with very high quantitative reproducibility (average r > 0.9 over 100 measurements and a median cv < 0.2). PGE2 is known to increase cellular cAMP levels, thereby activating PKA. The in-depth analysis revealed temporal regulation of a wide variety of phosphosites associated not only with PKA, but also with a variety of other classes of kinases. Following PGE2 stimulation, several pathways became only transiently activated, revealing that in-depth dynamic profiling requires techniques with high temporal resolution. Moreover, the large publicly available dataset provides a valuable resource for downstream PGE2 signaling dynamics in T cells, and cAMP-mediated signaling in particular. More generally, our method enables in-depth, quantitative, high-throughput phosphoproteome screening on any system, requiring very little sample, sample preparation, and analysis time.


Figures

Fig. 1.
Fig. 1.
High specificity and reproducibility of Ti4+-IMAC phosphopeptide enrichment assessed in HeLa cells. A, the high percentage of phosphopeptides in three separate enrichments indicates the high specificity of the Ti4+-IMAC enrichment. B, the overlap of identified phosphopeptides in three MS replicates from a single enrichment (MS 1–3, upper panel) is similar to the overlap of three separate enrichments (E1–E3, lower panel), indicating qualitatively highly reproducible phosphopeptide enrichment. C, phosphopeptide intensity (log base 2) comparisons for MS replicates (upper panel) and enrichment replicates (lower panel), showing highly accurate quantitative reproducibility of the Ti4+-IMAC enrichment method.
Fig. 2.
Fig. 2.
High-throughput label-free phosphoproteomics. A, three biological replicates of Jurkat T lymphocyte cells stimulated with prostaglandin E2 (PGE2) and harvested at six different time points were lysed, digested, and desalted prior to phosphopeptide enrichment. Each biological replicate was divided over three Ti4+-IMAC phosphopeptide enrichment columns, resulting in 54 samples that were analyzed twice via 2-h nano-LC-MS/MS with CID/ETD fragmentation, amounting to a total of 108 phosphoproteomic datasets. B, number of unique phosphosites quantified using different criteria. The minimum number of quantification events is reported in brackets. C, Pearson intensity correlation heat map of all runs showing high reproducibility in phosphosite intensity for the phosphopeptide enrichment replicates (yellow squares) and high similarity between biological replicates A–C (orange squares).
Fig. 3.
Fig. 3.
Analysis of differentially regulated phosphosites. A, volcano plots of treatment versus control comparisons. p values (−log base 10, two-sample t test) are plotted as a function of the phosphosite ratio (log base 2) for 5 and 60 min versus 0 min of PGE2 treatment. Regulated sites are colored in red (permutation based false discovery rate = 0.005, s0 adjusted for 2-fold regulation). B, soft clustering analysis of significantly regulated phosphosites resulted in five differentially up-regulated and three differentially down-regulated clusters. For each cluster, the phosphosite sequence logos is plotted, showing amino acid frequencies that are significantly different compared to the entire human proteome (p < 0.01). Early up-regulated sites contain basophilic motifs, late up-regulated sites contain acidophilic motifs, and down-regulated sites contain only proline directed consensus sites. C, linear kinase motifs enriched in each cluster by Motif-X analysis. Significantly overrepresented kinase motifs were determined by querying the data against the IPI human database using a p value of 1E-6, a minimum number of occurrences of 20, and a minimum 3.0-fold enrichment relative to background. D, kinases predicted to be active upon PGE2 stimulation according to the NetworKIN algorithm. The y-axis represents the percentage of phosphorylated substrates predicted for each kinase in each cluster.
Fig. 4.
Fig. 4.
Downstream signaling of PGE2 stimulation reveals early, intermediate, and late responders. A, network manually curated using the reference databases UniProt and PhosphoSitePlus. Arrows represent known phosphorylation events between upstream kinases and their substrates. B, protein complexes and/or networks of predicted PKA (left panel) and CK2 (right panel) substrates. Significantly regulated substrates for each cluster and additional proteins belonging to the same protein complex are shown in red and green, respectively. Interaction data and common protein features were retrieved from the STRING and UniProt databases, respectively. See supplemental Figs. S5 and S6 for a more detailed version.

References

    1. Hanahan D., Weinberg R. A. (2011) Hallmarks of cancer: the next generation. Cell 144, 646–674 - PubMed
    1. Van Vlierberghe P., Ferrando A. (2012) The molecular basis of T cell acute lymphoblastic leukemia. J. Clin. Invest. 122, 3398–3406 - PMC - PubMed
    1. Kalinski P. (2012) Regulation of immune responses by prostaglandin E2. J. Immunol. 188, 21–28 - PMC - PubMed
    1. Chemnitz J. M., Driesen J., Classen S., Riley J. L., Debey S., Beyer M., Popov A., Zander T., Schultze J. L. (2006) Prostaglandin E2 impairs CD4+ T cell activation by inhibition of lck: implications in Hodgkin's lymphoma. Cancer Res. 66, 1114–1122 - PubMed
    1. Altelaar A. F., Munoz J., Heck A. J. (2013) Next-generation proteomics: towards an integrative view of proteome dynamics. Nat. Rev. Genet. 14, 35–48 - PubMed

Publication types