

Atomic force microscopy-based microrheology reveals significant differences in the viscoelastic response between malign and benign cell lines
- PMID: 24850913
- PMCID: PMC4042852
- DOI: 10.1098/rsob.140046
Atomic force microscopy-based microrheology reveals significant differences in the viscoelastic response between malign and benign cell lines
Abstract
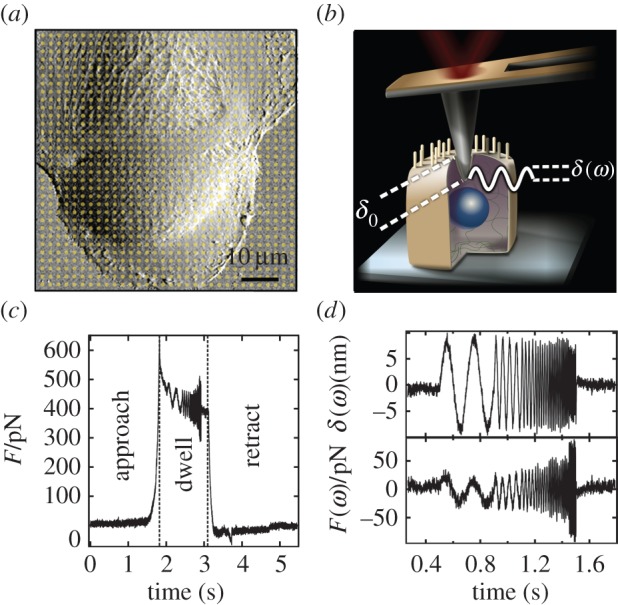
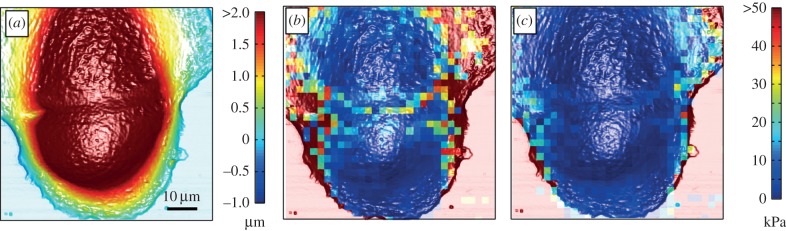
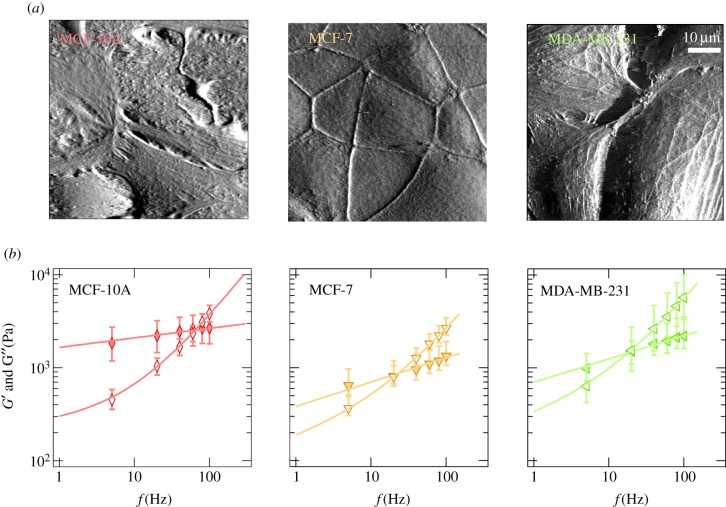
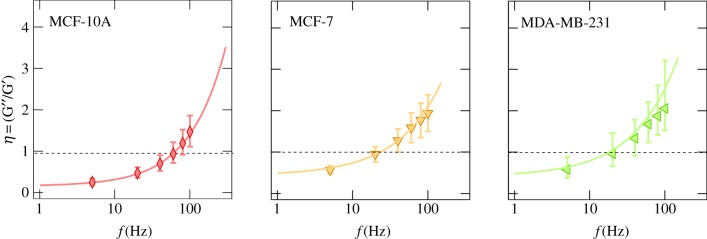
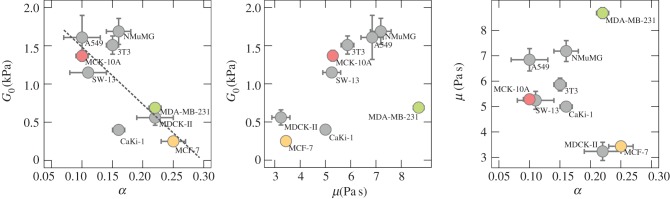
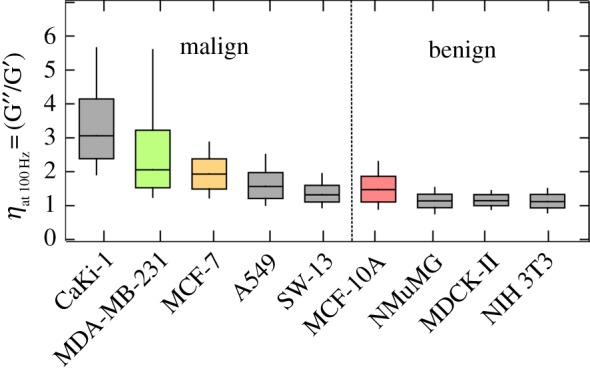
Mechanical phenotyping of cells by atomic force microscopy (AFM) was proposed as a novel tool in cancer cell research as cancer cells undergo massive structural changes, comprising remodelling of the cytoskeleton and changes of their adhesive properties. In this work, we focused on the mechanical properties of human breast cell lines with different metastatic potential by AFM-based microrheology experiments. Using this technique, we are not only able to quantify the mechanical properties of living cells in the context of malignancy, but we also obtain a descriptor, namely the loss tangent, which provides model-independent information about the metastatic potential of the cell line. Including also other cell lines from different organs shows that the loss tangent (G″/G') increases generally with the metastatic potential from MCF-10A representing benign cells to highly malignant MDA-MB-231 cells.
Keywords: atomic force microscopy; cancer; microrheology; viscoelasticity.
Figures
References
-
- Hanahan D, Weinberg RA. 2011. Hallmarks of cancer: the next generation. Cell 144, 646–674. (doi:10.1016/J.Cell.2011.02.013) - DOI - PubMed
-
- Olson MF, Sahai E. 2009. The actin cytoskeleton in cancer cell motility. Clin. Exp. Metastasis 26, 273–287. (doi:10.1007/S10585-008-9174-2) - DOI - PubMed
-
- Suresh S, Spatz J, Mills JP, Micoulet A, Dao M, Lim CT, Beil M, Seufferlein T. 2005. Connections between single-cell biomechanics and human disease states: gastrointestinal cancer and malaria. Acta Biomater. 1, 15–30. (doi:10.1016/J.Actbio.2004.09.001) - DOI - PubMed
-
- Agus DB, et al. 2013. A physical sciences network characterization of non-tumorigenic and metastatic cells. Sci. Rep. UK 3, 1449 (doi:10.1038/Srep01449) - DOI - PMC - PubMed
-
- Rosenbluth MJ, Lam WA, Fletcher DA. 2006. Force microscopy of nonadherent cells: a comparison of leukemia cell deformability. Biophys. J. 90, 2994–3003. (doi:10.1529/Biophysj.105.067496) - DOI - PMC - PubMed
Publication types
MeSH terms
LinkOut - more resources
Full Text Sources
Other Literature Sources
Medical
Miscellaneous