. 2014 Jun;42(11):6972-86.
doi: 10.1093/nar/gku374. Epub 2014 May 22.

Identification of a large protein network involved in epigenetic transmission in replicating DNA of embryonic stem cells

Affiliations

Identification of a large protein network involved in epigenetic transmission in replicating DNA of embryonic stem cells

Sergi Aranda et al. Nucleic Acids Res. 2014 Jun.

Abstract

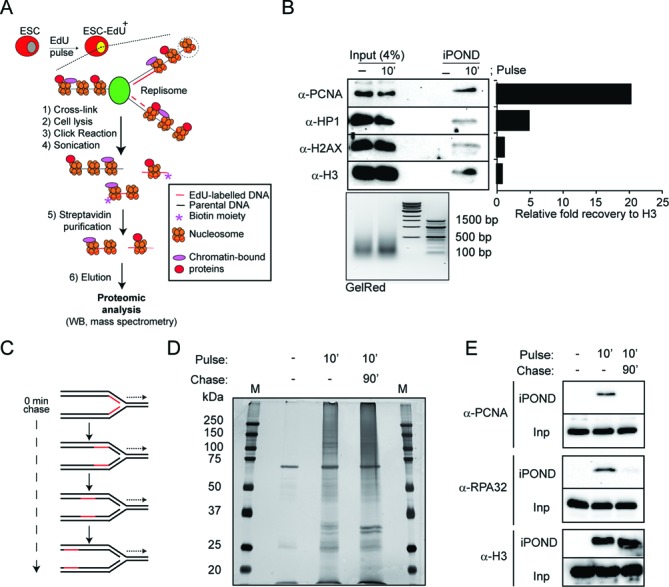
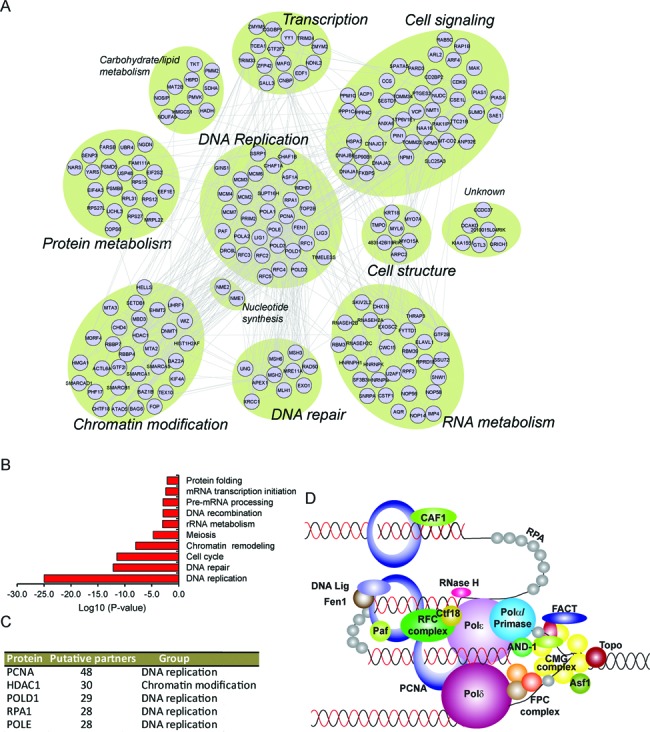
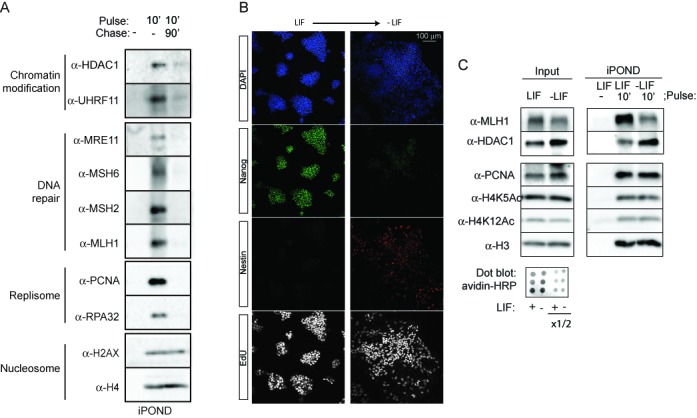
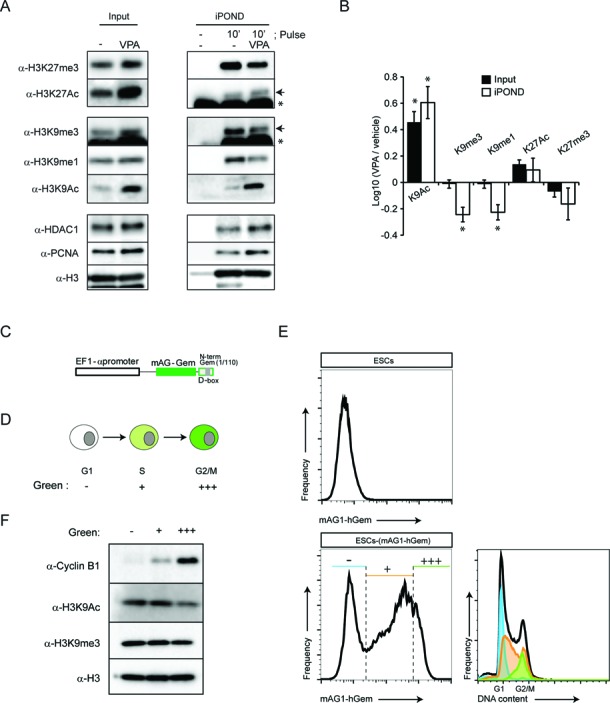
Pluripotency of embryonic stem cells (ESCs) is maintained by transcriptional activities and chromatin modifying complexes highly organized within the chromatin. Although much effort has been focused on identifying genome-binding sites, little is known on their dynamic association with chromatin across cell divisions. Here, we used a modified version of the iPOND (isolation of proteins at nascent DNA) technology to identify a large protein network enriched at nascent DNA in ESCs. This comprehensive and unbiased proteomic characterization in ESCs reveals that, in addition to the core replication machinery, proteins relevant for pluripotency of ESCs are present at DNA replication sites. In particular, we show that the chromatin remodeller HDAC1-NuRD complex is enriched at nascent DNA. Interestingly, an acute block of HDAC1 in ESCs leads to increased acetylation of histone H3 lysine 9 at nascent DNA together with a concomitant loss of methylation. Consistently, in contrast to what has been described in tumour cell lines, these chromatin marks were found to be stable during cell cycle progression of ESCs. Our results are therefore compatible with a rapid deacetylation-coupled methylation mechanism during the replication of DNA in ESCs that may participate in the preservation of pluripotency of ESCs during replication.


Figures

Figure 1.
Figure 1.
Isolation of proteins on nascent DNA in ESCs. (A) Schematic representation of the modified iPOND technique. Cells were incubated with a short pulse of EdU, which was then incorporated into nascent DNA. The DNA and associated proteins were cross-linked (i), cells were lysed (ii), and labelled DNA was conjugated to a biotin group by a Click reaction (iii) and then fragmented by sonication (iv). Labelled DNA fragments were isolated using streptavidin magnetic beads (v) and eluted using Laemmli Buffer (vi). Eluted samples were analysed by western blot or high-resolution mass spectrometry. ESC, embryonic stem cells. ESC−EdU+, embryonic stem cells pulsed with EdU. (B) Input and the isolated proteins on nascent DNA (iPOND) from ESCs non-pulsed (−) and pulsed 10 min (10′) with EdU were analysed by western blot using the indicated antibodies. The sonicated DNA was analysed by agarose gel electrophoresis (GelRed). The histogram shows the relative fold recovery of the indicated proteins by iPOND. (C) Schematic representation of EdU labelled (red) replication fork progression after a short pulse of EdU. (D) Nascent DNA was isolated using the modified iPOND technique from ESCs incubated with EdU as indicated. The samples were separated by SDS-PAGE, and the gel was silver stained. Molecular weights (kDa) for the protein marker (M) are indicated. (E) ESCs were pulsed with EdU for 10 min. When indicated, pulsed cells were chased for 90 min after washing out the EdU from the media. The input (Inp) and the iPOND samples were analysed by western blot using the indicated antibodies.
Figure 2.
Figure 2.
Identification of a protein interaction network associated with nascent DNA in ESCs. (A) The protein–protein interaction network of the proteome as defined by STRING analysis. The topology is organized according to functional classification, as indicated. (B) Gene ontology (GO) analysis of the biological processes of the proteins identified at nascent DNA. The bars indicate the log10 (P-value) for the enriched groups. P-values represent a modified Fisher Exact Test, EASE Score. (C) List of the top five proteins with most interacting partners retrieved from the protein–protein interaction network. (D) Schematic depiction of replication-associated factors that were identified in this study. At least one component of each of the indicated multi-protein complexes was present in our data set. Abbreviations: CMG, for CDC45, MCM2–7 helicases and Gins complex; FPC, for fork-protecting complex (containing TIMELESS, TIPIN and CLASPIN proteins); FACT, for Facilitates chromatin transcription complex (containing SSRP1 and SUPT16H); RFC, for replication factor C complex (containing RFC1–5).
Figure 3.
Figure 3.
Differential recruitment of MMR proteins at nascent DNA.(A) ESCs were incubated with EdU as indicated. The iPOND samples were analysed by western blot using the indicated antibodies. Functional clusters according to Figure 2 are indicated. (B) ESCs were differentiated in N2B27 media and stained with anti-Nanog and anti-Nestin antibodies. The cells in S-phase were labelled by EdU and visualized using the Click reaction. (C) ESCs and differentiated cells were incubated with EdU as indicated. The input and the iPOND samples were analysed by western blot using the indicated antibodies. The amount of EdU-labelled DNA was analysed by dot-blot.
Figure 4.
Figure 4.
The HDAC1–NuRD complex is enriched at nascent DNA in ESCs. (A) Tandem purification procedure. Extracts from ESCs pulsed with EdU were immunoprecipitated first using an anti-HDAC1 antibody. The precipitates were eluted with a competitive peptide and nascent DNA purified by iPOND. The samples were analysed by western blot using the indicated antibody. Note that the sonication yielded small DNA fragments (GelRed). (B) Table indicating the proteins identified as HDAC1-interacting partners by the tandem purification procedure and mass spectrometry and/or western blot. The presence of each component in the iPOND-MS analysis is indicated. Green indicates identified proteins using IP-iPOND, red indicates identified proteins by iPOND and blue the respective chromatin-modifying complex they associate with. (C) ESCs were incubated with EdU as indicated. The iPOND samples were analysed by western blot using the indicated antibodies. (D) Histogram showing quantitative measurements of the relative binding to chromatin for the indicated proteins normalized by the levels of histone H3 (average ± SEM, biological replicates n = 4, **P < 0.01, #P = 0.1, t-test). (E) ESCs and NIH-3T3 were pulsed with EdU for 10 min and samples were normalized according to the normalization procedure outlined in (Supplementary Figure S1). Input (Inp) and iPOND samples were analysed by western blot using the indicated antibodies. (F) ESCs were transfected with a control siRNA (siControl) or siRNA directed against HDAC1 (siHDAC1). Nascent DNA was then isolated by iPOND technique. The input and iPOND samples were analysed by western blot using the indicated antibodies. (G) Dot-blot from sheared samples transfected with control siRNA (siControl) or siRNA directed against HDAC1 (siHDAC1). (H) Histogram showing the percentage of binding at nascent DNA for the proteins indicated normalized by PCNA (average ± SEM, biological replicates n = 2, #P = 0.1, *P < 0.05, **P < 0.01, t-test).
Figure 5.
Figure 5.
The nucleosomal remodelling and deacetylase (NuRD) complex is associated with the epigenetic regulator UHRF1 in ESCs. (A) ESC extracts were immunoprecipitated using an anti-UHRF1 antibody in the presence of ethidium bromide to prevent indirect binding via DNA. Input and immunocomplexes were analysed by western blot. The arrow indicates the specific HDAC1 band and the asterisks point to an unspecific cross-reacting band. (B) ESCs were transfected with siControl or CHD4-specific siRNA. The efficiency of the knock-down was analysed by western blot. (C) ESCs transfected with siControl or CHD4-specific siRNA were treated with the translational inhibitor cycloheximide (CHX) for indicated times (in hours). Total cell extracts were then analysed by western blot. (D) The graph indicates the average of protein expression decay at different time points (average ± SEM, biological replicates n = 2, *P < 0.05, t-test)). The levels of UHRF1 were normalized against the levels of GAPDH and the time point 0 was set as 1 in each condition. The arrows indicate the estimated half-life for siControl and siCHD4 transfected ESCs. (E) ESCs were transfected with siControl or CHD4-specific siRNA and treated with the proteasome inhibitor MG132 in the presence of cycloheximide for 2 h (CHX). Total cell extracts were then analysed by western blot.
Figure 6.
Figure 6.
The acetylation and methylation of H3K9 are functionally linked upon replication fork passage in ESC. (A) ESCs were incubated with 1 mM VPA for 30 min and labelled the last 10 min with EdU. Input and iPOND samples were analysed by western blot using the indicated antibodies. The arrows indicate specific bands for H3K9me3 and H3K27Ac, the asterisks indicate an unspecific cross-reaction of the antibody. (B) Quantification of the average relative enrichment for the repressive histone marks lysine 9 mono- and trimehtylation and lysine 27 trimethylation (K9me1, K9me3 and K27me3, respectively) of histone H3 and its corresponding acetylated forms (K9Ac and K27Ac), normalized by the levels of PCNA (average ± SEM, biological replicates n = 3; *P < 0.05, t-test). (C) Scheme of FUCCI reporter mAG1-hGem transfected in ESCs. (D) Coloured code scheme for the ESCs transiently transfected with the FUCCI reported mAG-hGem. (E) ESCs expressing the FUCCI reporter gene were analysed by flow cytometry. The histogram shows the proportion of cells and fluorescence intensity. The DNA content for each gated population is indicated. Green negative population (blue marked) are cells in G1 phase, low-medium intensity green positive population (orange marked) are cells in S phase, and high intensity green positive population (green marked) are cells in late S/G2/M phase. (F) ESCs expressing the FUCCI reporter gene were isolated by FACS and total cell extracts were analysed by western blot with the indicated antibodies.

Similar articles

Cited by

References

    1. Young R.A. Control of the embryonic stem cell state. Cell. 2011;144:940–954. - PMC - PubMed
    1. Tsubouchi T., Fisher A.G. Reprogramming and the pluripotent stem cell cycle. Curr. Top. Dev. Biol. 2013;104:223–241. - PubMed
    1. Orkin S.H., Hochedlinger K. Chromatin connections to pluripotency and cellular reprogramming. Cell. 2011;145:835–850. - PMC - PubMed
    1. Hu G., Wade P.A. NuRD and pluripotency: a complex balancing act. Cell Stem Cell. 2012;10:497–503. - PMC - PubMed
    1. Ku M., Koche R.P., Rheinbay E., Mendenhall E.M., Endoh M., Mikkelsen T.S., Presser A., Nusbaum C., Xie X., Chi A.S., et al. Genomewide analysis of PRC1 and PRC2 occupancy identifies two classes of bivalent domains. PLoS Genet. 2008;4:e1000242. - PMC - PubMed

Publication types

MeSH terms