

Genome-wide association study and mouse expression data identify a highly conserved 32 kb intergenic region between WNT3 and WNT9b as possible susceptibility locus for isolated classic exstrophy of the bladder
- PMID: 24852367
- PMCID: PMC4168827
- DOI: 10.1093/hmg/ddu259
Genome-wide association study and mouse expression data identify a highly conserved 32 kb intergenic region between WNT3 and WNT9b as possible susceptibility locus for isolated classic exstrophy of the bladder
Abstract
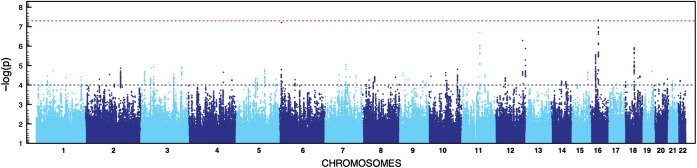
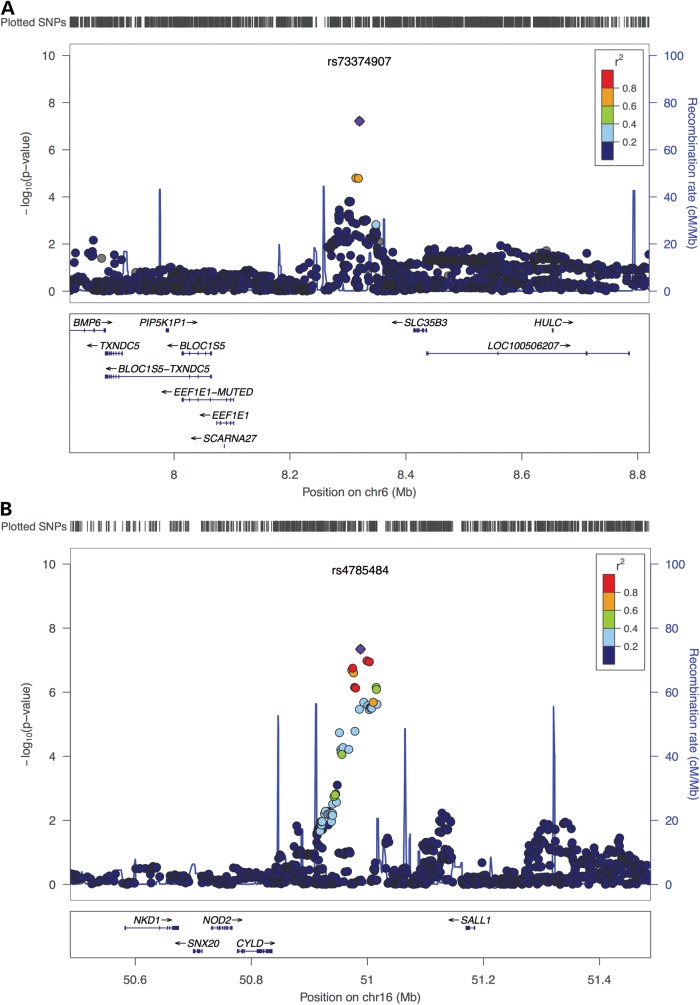
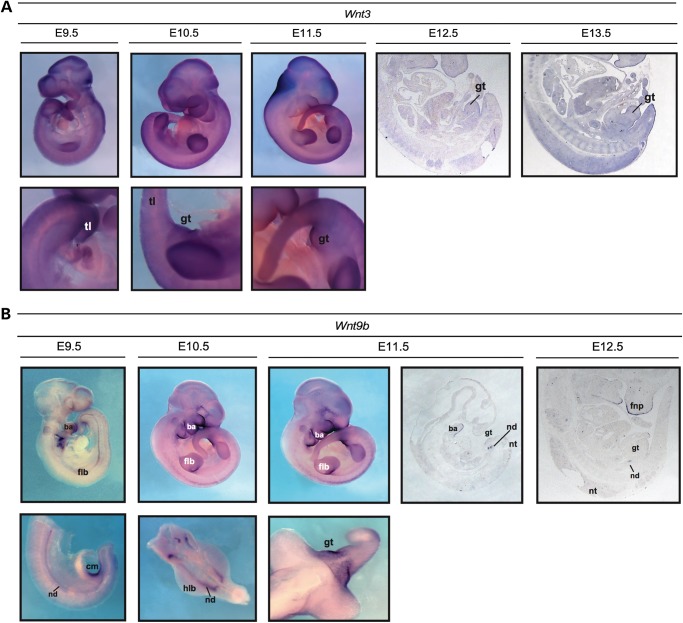
Bladder exstrophy-epispadias complex (BEEC), the severe end of the urorectal malformation spectrum, has a profound impact on continence as well as sexual and renal functions. It is widely accepted that for the majority of cases the genetic basis appears to be multifactorial. Here, we report the first study which utilizes genome-wide association methods to analyze a cohort comprising patients presenting the most common BEEC form, classic bladder exstrophy (CBE), to identify common variation associated with risk for isolated CBE. We employed discovery and follow-up samples comprising 218 cases/865 controls and 78 trios in total, all of European descent. Our discovery sample identified a marker near SALL1, showing genome-wide significant association with CBE. However, analyses performed on follow-up samples did not add further support to these findings. We were also able to identify an association with CBE across our study samples (discovery: P = 8.88 × 10(-5); follow-up: P = 0.0025; combined: 1.09 × 10(-6)) in a highly conserved 32 kb intergenic region containing regulatory elements between WNT3 and WNT9B. Subsequent analyses in mice revealed expression for both genes in the genital region during stages relevant to the development of CBE in humans. Unfortunately, we were not able to replicate the suggestive signal for WNT3 and WNT9B in a sample that was enriched for non-CBE BEEC cases (P = 0.51). Our suggestive findings support the hypothesis that larger samples are warranted to identify association of common variation with CBE.
© The Author 2014. Published by Oxford University Press. All rights reserved. For Permissions, please email: journals.permissions@oup.com.
Figures
References
-
- Carey J.C. Exstrophy of the cloaca and the OEIS complex: one and the same. Am. J. Med. Genet. 2001;99:270. - PubMed
-
- Gearhart J. In: Campbell's Urology. Campbell M., Walsh P., Retik A., editors. Philadelphia, PA: Saunders; 2002. pp. 2136–2196.
-
- Reutter H., Lee C., Grasser M.F., Noeker M. Subjective developmental outcome in bladder exstrophy and epispadias. A pilot study. Urologe A. 2005;44:57–63. - PubMed
-
- Lee C., Reutter H.M., Grasser M.F., Fisch M., Noeker M. Gender-associated differences in the psychosocial and developmental outcome in patients affected with the bladder exstrophy-epispadias complex. BJU Int. 2006;97:349–353. - PubMed
Publication types
MeSH terms
Substances
Grants and funding
LinkOut - more resources
Full Text Sources
Other Literature Sources
Molecular Biology Databases
