. 2014 Oct 1;23(19):5227-42.
doi: 10.1093/hmg/ddu244. Epub 2014 May 22.

The deubiquitinase USP15 antagonizes Parkin-mediated mitochondrial ubiquitination and mitophagy

Affiliations

The deubiquitinase USP15 antagonizes Parkin-mediated mitochondrial ubiquitination and mitophagy

Tom Cornelissen et al. Hum Mol Genet. .

Abstract

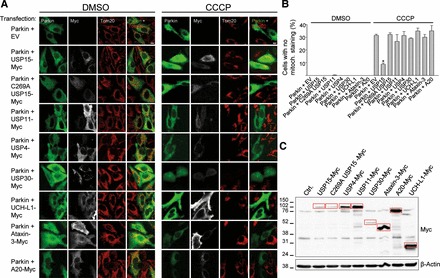
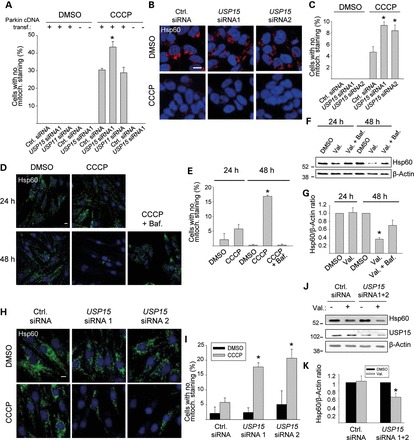
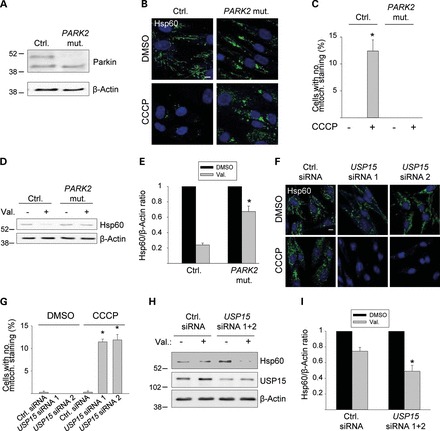
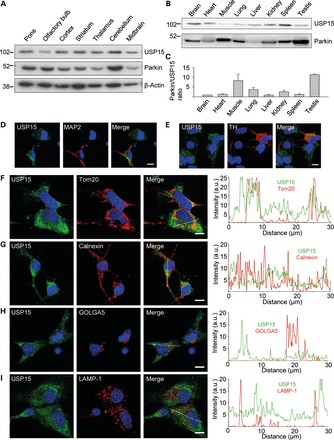
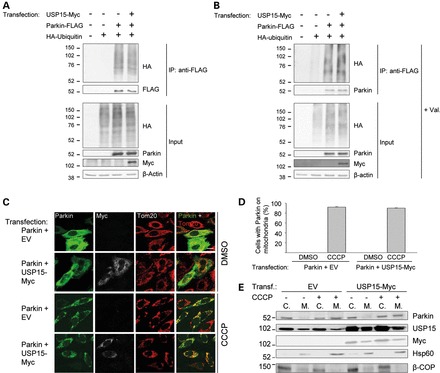
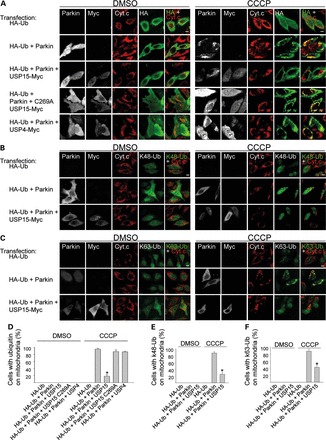
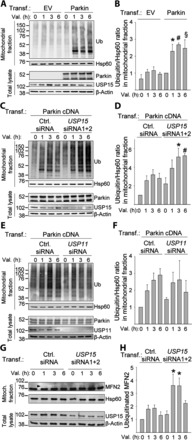
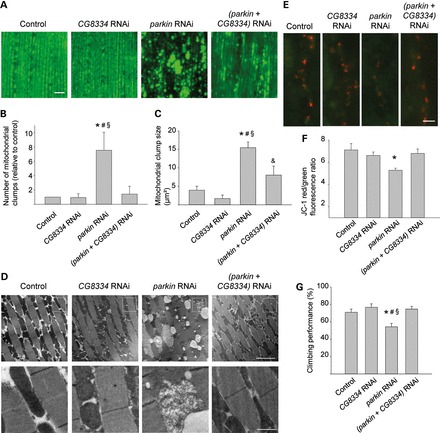
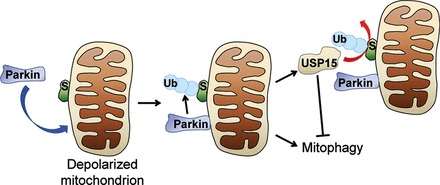
Loss-of-function mutations in PARK2, the gene encoding the E3 ubiquitin ligase Parkin, are the most frequent cause of recessive Parkinson's disease (PD). Parkin translocates from the cytosol to depolarized mitochondria, ubiquitinates outer mitochondrial membrane proteins and induces selective autophagy of the damaged mitochondria (mitophagy). Here, we show that ubiquitin-specific protease 15 (USP15), a deubiquitinating enzyme (DUB) widely expressed in brain and other organs, opposes Parkin-mediated mitophagy, while a panel of other DUBs and a catalytically inactive version of USP15 do not. Moreover, knockdown of USP15 rescues the mitophagy defect of PD patient fibroblasts with PARK2 mutations and decreased Parkin levels. USP15 does not affect the ubiquitination status of Parkin or Parkin translocation to mitochondria, but counteracts Parkin-mediated mitochondrial ubiquitination. Knockdown of the DUB CG8334, the closest homolog of USP15 in Drosophila, largely rescues the mitochondrial and behavioral defects of parkin RNAi flies. These data identify USP15 as an antagonist of Parkin and suggest that USP15 inhibition could be a therapeutic strategy for PD cases caused by reduced Parkin levels.


Figures

Figure 1.
Figure 1.
USP15 counteracts Parkin-mediated mitophagy through its deubiquitinating activity. (A) HeLa cells were transfected with Parkin and empty vector (EV) or cotransfected with Parkin and Myc-tagged versions of USP15, the catalytically inactive C269A USP15 mutant, USP11, USP4, USP30, UCH-L1, Ataxin-3 or A20. At 24 h after transfection, cells were treated for 24 h with DMSO or CCCP (10 µm) and immunostained for Parkin, Myc and the mitochondrial marker Tom20. Scale bar, 10 μm. (B) The percentage of Parkin-positive cells (in the condition transfected with Parkin alone) or Parkin- and Myc-positive cells (in the conditions cotransfected with Parkin and DUBs) without detectable Tom20 immunoreactivity was quantified (n ≥ 3). *P < 0.001 compared with CCCP-treated cells transfected with Parkin alone. (C) Anti-Myc WB showing expression levels of the Myc-tagged DUBs (indicated by the red boxes).
Figure 2.
Figure 2.
Knockdown of USP15 enhances mitophagy in HeLa cells, SH-SY5Y cells and primary human fibroblasts. (A) HeLa cells were transfected with empty vector or Parkin cDNA and with siRNAs, as indicated, treated with CCCP (10 µm) for 24 h and immunostained for Parkin and Tom20. The percentage of cells (in the conditions that were not transfected with Parkin) or Parkin-positive cells (in the conditions transfected with Parkin) without mitochondrial staining was quantified (n = 3). *P < 0.001 compared with the CCCP-treated condition transfected with control (Ctrl.) siRNA and Parkin cDNA. (B and C) SH-SY5Y cells were transfected with the indicated siRNAs, treated with CCCP (25 µm) for 24 h and immunostained for Hsp60. (C) Quantification of the percentage cells without mitochondrial staining (n = 3). *P < 0.005 compared with the CCCP-treated control siRNA condition. (D–G) Fibroblasts from healthy control 1 were treated with DMSO, CCCP (10 µm), CCCP + bafilomycin (Baf., 100 nm), valinomycin (Val., 1 µm) or valinomycin + bafilomycin for 24 or 48 h, as indicated, followed by anti-Hsp60 immunostaining (D and E) or western blot (F and G). (E) Quantification of the percentage cells without detectable Hsp60 immunoreactivity (n = 3). *P < 0.001 compared with the 48 h DMSO condition. (G) Quantification of the Hsp60/β-Actin ratio on western blot, normalized to this ratio in the DMSO condition (n = 7). *P < 0.005 compared with the 48 h DMSO condition. (H–K) Fibroblasts from control 1 were transfected with the indicated siRNAs and treated with DMSO, CCCP or valinomycin for 24 h, followed by anti-Hsp60 immunostaining (H, I) or western blot (J and K). (I) Quantification of the percentage cells without detectable Hsp60 immunoreactivity (n = 3). * P ≤ 0.01 compared with the CCCP-treated control siRNA condition. (K) Quantification of the Hsp60/β-Actin ratio on western blot, normalized to this ratio in the DMSO condition (n = 5). * P < 0.05 compared with the DMSO condition.
Figure 3.
Figure 3.
Knockdown of USP15 rescues the mitophagy defect of PARK2 mutant PD patient fibroblasts. (A) Fibroblasts from a PD patient with c.8_171del/c.535_871del PARK2 mutations (PARK2 mut.) and from age-matched healthy control 2 (Ctrl.) were analyzed by western blotting for Parkin expression. (B–E) Mutant and control 2 fibroblasts were treated for 48 h with DMSO, CCCP or valinomycin (Val.), as indicated, followed by anti-Hsp60 immunostaining (B and C) or western blotting (D and E). (C) Quantification of the percentage cells without detectable Hsp60 immunoreactivity (n = 3). * P < 0.001 compared with DMSO-treated control fibroblasts. (E) Quantification of the Hsp60/β-Actin ratio on western blot, normalized to this ratio in the DMSO condition (n = 3). * P < 0.01 compared with valinomycin-treated control fibroblasts. (F–I) PARK2 mutant fibroblasts were transfected with the indicated siRNAs and treated for 48 h with DMSO, CCCP or valinomycin, as indicated, followed by anti-Hsp60 immunostaining (F, G) or western blotting (H, I). (G) Quantification of the percentage cells without detectable Hsp60 immunoreactivity (n = 3). *P < 0.001 compared with the CCCP-treated control siRNA condition. (I) Quantification of the Hsp60/β-Actin ratio on western blot, normalized to this ratio in the DMSO condition (n = 8). *P < 0.001 compared with the valinomycin-treated control siRNA condition. Scale bars, 10 µm.
Figure 4.
Figure 4.
Anatomical, cellular and subcellular distribution of USP15. (A) Extracts from 2- to 3-month-old mouse brain regions (30 μg of total protein per region) were analyzed using WB with the indicated antibodies. (B and C) Extracts from 2- to 3-month-old mouse organs (30 μg of total protein per organ) were analyzed by WB to compare Parkin and USP15 expression levels on the same blot. (C) The Parkin/USP15 expression level ratio was quantified and normalized to the ratio in brain (n = 4). (D–I) Mouse embryonic midbrain cultures were double-labeled for USP15 and either the neuronal marker MAP2 (D), the dopaminergic marker tyrosine hydroxylase (TH) (E), the mitochondrial marker Tom20 (F), the ER marker calnexin (G), the Golgi marker GOLGA5 (H) or the lysosomal marker LAMP-1 (I). Graphs in (F–I) depict the relative intensities of each channel over the drawn lines shown in the merged images. A.U., arbitrary units. Scale bars, 10 µm.
Figure 5.
Figure 5.
USP15 does not affect the ubiquitination status of Parkin or the translocation of Parkin to depolarized mitochondria. (A and B) HeLa cells were transfected with combinations of HA-tagged ubiquitin, FLAG-tagged Parkin and Myc-tagged USP15, as indicated. At 24 h after transfection, extracts were made in denaturing conditions to dissociate Parkin from its binding partners. After dilution in non-denaturing buffer, immunoprecipitation was performed with anti-FLAG. The immunoprecipitate (IP) and input samples were resolved by SDS–PAGE and western blot with the indicated antibodies. The experiment was performed in basal conditions (A) or after treatment with valinomycin (Val., 1 μm) for 3 h (B). (C and D) HeLa cells were transfected with Parkin and empty vector (EV) or with Parkin and Myc-tagged USP15, as indicated. At 24 h after transfection, cells were treated with DMSO or CCCP (10 µm) for 3 h and immunostained for Parkin, Myc or Tom20. Scale bar, 10 μm. (D) Quantification of the percentage of Parkin-positive cells (in the conditions transfected with Parkin and EV) or Parkin- and Myc-positive cells (in the conditions transfected with Parkin and USP15-Myc) in which Parkin colocalized with mitochondria (n = 3). (E) HEK293 cells were transfected with EV or Myc-tagged USP15 and treated with DMSO or CCCP (10 µm) for 3 h. Cells were fractionated into cytosolic (C.) and mitochondria-enriched (M.) fractions. After loading the same total amount of protein on the gel for each fraction, SDS–PAGE and immunoblotting were performed for Parkin, USP15, Myc, the mitochondrial marker Hsp60 and the non-mitochondrial protein β-COP.
Figure 6.
Figure 6.
USP15 counteracts Parkin-mediated mitochondrial ubiquitination. (A–C) HeLa cells were transfected with combinations of HA-tagged ubiquitin (HA-Ub), Parkin and Myc-tagged DUBs. After 24 h, cells were treated with DMSO or CCCP (10 µm) for 6 h, followed by quadruple immunostaining for Parkin, Myc, the mitochondrial marker cytochrome c (Cyt. c) and either HA (A), K48-linked ubiquitin chains (K48-Ub) (B) or K63-linked ubiquitin chains (K63-Ub) (C). (D–F) The percentage cells in which HA-Ub (D), K48-Ub (E) and K63-Ub (F) colocalized with mitochondria was quantified among the HA-positive cells (in conditions transfected with HA-Ub alone), the HA- and Parkin-positive cells (in conditions cotransfected with HA-Ub and Parkin) and the HA-, Parkin- and Myc-positive cells (in conditions cotransfected with HA-Ub, Parkin and Myc-tagged DUBs) (n ≥ 3). *P < 0.001 compared with CCCP-treated cells transfected with HA-Ub and Parkin (D–F), with HA-Ub, Parkin and USP15 C269A (D), and with HA-Ub, Parkin and USP4 (D).
Figure 7.
Figure 7.
Knockdown of USP15 enhances Parkin-mediated mitochondrial ubiquitination. (A and B) HeLa cells were transfected with empty vector (EV) or Parkin cDNA and treated with valinomycin (Val., 1 µm) for 0, 1, 3 or 6 h, followed by subcellular fractionation and WB of mitochondrial fractions and total lysates with the indicated antibodies. (B) Quantification of the ubiquitin/Hsp60 ratio in the mitochondrial fractions, normalized to this ratio in the Parkin-transfected condition after 0 h of valinomycin (n = 5–9). *P<0.05, #P<0.05 and §P<0.05, compared with valinomycin treatment for 1, 3 or 6 h, respectively, in the EV-transfected cells. (C and D) HeLa cells were transfected with Parkin cDNA and either control (Ctrl.) siRNA or a combination of USP15 siRNAs 1 and 2, and treated with valinomycin for 0, 1, 3 or 6 h, followed by WB of mitochondrial fractions and total lysates. (D) Quantification of the ubiquitin/Hsp60 ratio in the mitochondrial fractions, normalized to this ratio in cells transfected with control siRNA after 0 h of valinomycin (n = 3). *P<0.05 and #P<0.01 versus valinomycin treatment for 3 or 6 h, respectively, in the control siRNA-transfected cells. (E and F) HeLa cells were transfected with Parkin cDNA and either control siRNA or USP11 siRNA, and treated with valinomycin for 0, 1, 3 or 6 h, followed by WB of mitochondrial fractions and total lysates. (F) Quantification of the ubiquitin/Hsp60 ratio in the mitochondrial fractions, normalized to this ratio in cells transfected with control siRNA after 0 h of valinomycin (n = 6). (G and H) Fibroblasts from control 1 were transfected with either control siRNA or a combination of USP15 siRNAs 1 and 2, and treated with valinomycin (1 µm) together with MG132 (20 μm) for 0, 1, 3 or 6 h, followed by WB of mitochondrial fractions and total lysates for mitofusin-2 (MFN2) and other indicated antibodies. Arrowhead indicates the position of the ubiquitinated MFN2 band. (H) Quantification of the amount of ubiquitinated MFN2, normalized to this amount in cells transfected with control siRNA after 0 h of valinomycin (n = 9). *P<0.001 compared with control siRNA-transfected cells after 0 h of valinomycin treatment.
Figure 8.
Figure 8.
CG8334 knockdown rescues parkin RNAi phenotypes in Drosophila. (A–D) Morphological analysis of mitoGFP-expressing indirect flight muscle from 1-week-old control (w1118; UAS-mitoGFP/+; mef-2-GAL4/+), CG8334 RNAi (w1118; UAS-mitoGFP/+; CG8334 RNAi/mef-2-GAL4), parkin RNAi (w1118; UAS-mitoGFP/parkin RNAi; mef-2-GAL4/+) and (parkin + CG8334) RNAi (w1118; UAS-mitoGFP/parkin RNAi; mef-2-GAL4/CG8334 RNAi) flies. (A) Confocal images of mitoGFP in indirect flight muscle. Scale bar, 10 µm. (B) Quantification of the number of mitochondrial clumps larger than 5 µm² in mitoGFP-expressing indirect flight muscle, normalized to control (n = 6 flies per genotype). *P < 0.05 compared with Control; #P < 0.05 compared with CG8334 RNAi; §P < 0.05 compared with (parkin + CG8334) RNAi. (C) Quantification of mitochondrial clump size in mitoGFP-expressing muscle (n = 6 flies per genotype). *P < 0.001 compared with Control; #P < 0.001, &P < 0.05 compared with CG8334 RNAi; §P < 0.01 compared with (parkin + CG8334) RNAi. (D) EM images of indirect flight muscle. The bottom row shows magnifications of the boxed areas in the row above. Scale bars, first row: 5 µm; second row: 1 µm. (E and F) Mitochondrial membrane potential (Δψm) at third instar larval boutons of control (w1118; tub-GAL4/+), CG8334 RNAi (w1118; ; CG8334 RNAi/tub-GAL4), parkin RNAi (w1118; parkin RNAi/+; tub-GAL4/+) and (parkin + CG8334) RNAi (w1118; parkin RNAi/+; CG8334 RNAi/tub-GAL4) flies was imaged using JC-1, a potentiometric green fluorescent dye that shifts to red fluorescence within mitochondria with a normal negative Δψm (red, JC-1 aggregates; green, JC-1 monomers). Scale bar, 5 µm. (F) Quantification of red over green fluorescence intensity in synaptic mitochondria normalized to control (n ≥ 15 synapses per genotype). *P < 0.005 compared with control. (G) Analysis of negative geotaxis in 2-week-old flies with the same genotypes as in (E) and (F) (n = 10 batches of 10 flies per genotype). The percentage flies that cross a 4 cm line in 15 s after tapping the flies down is indicated. *P < 0.05 compared with Control; #P < 0.01 compared with CG8334 RNAi; §P < 0.005 compared with parkin + CG8334 RNAi.
Figure 9.
Figure 9.
Model of antagonistic control of mitochondrial ubiquitination and mitophagy by Parkin and USP15. S, substrate. Ub, ubiquitin.

References

    1. Lees A.J., Hardy J., Revesz T. Parkinson's disease. Lancet. 2009;373:2055–2066. - PubMed
    1. Corti O., Lesage A., Brice A. What genetics tells us about the causes and mechanisms of Parkinson's disease. Physiol. Rev. 2011;91:1161–1218. - PubMed
    1. Pawlyk A.C., Giasson B.I., Sampathu D.M., Perez F.A., Lim K.L., Dawson V.L., Dawson T.M., Palmiter R.D., Trojanowski J.Q., Lee V.M. Novel monoclonal antibodies demonstrate biochemical variation of brain parkin with age. J. Biol. Chem. 2003;278:48120–48128. - PubMed
    1. Winklhofer K.F., Henn I.H., Kay-Jackson P.C., Heller U., Tatzelt J. Inactivation of parkin by oxidative stress and C-terminal truncations: a protective role of molecular chaperones. J. Biol. Chem. 2003;278:47199–47208. - PubMed
    1. Chung K.K., Thomas B., Li X., Pletnikova O., Troncoso J.C., Marsh L., Dawson V.L., Dawson T.M. S-nitrosylation of parkin regulates ubiquitination and compromises parkin's protective function. Science. 2004;304:1328–1331. - PubMed

Publication types

MeSH terms