. 2014 May 23:5:3902.
doi: 10.1038/ncomms4902.

eIF2B is a decameric guanine nucleotide exchange factor with a γ2ε2 tetrameric core

Affiliations
Free PMC article

eIF2B is a decameric guanine nucleotide exchange factor with a γ2ε2 tetrameric core

Yuliya Gordiyenko et al. Nat Commun. .
Free PMC article

Abstract

eIF2B facilitates and controls protein synthesis in eukaryotes by mediating guanine nucleotide exchange on its partner eIF2. We combined mass spectrometry (MS) with chemical cross-linking, surface accessibility measurements and homology modelling to define subunit stoichiometry and interactions within eIF2B and eIF2. Although it is generally accepted that eIF2B is a pentamer of five non-identical subunits (α-ε), here we show that eIF2B is a decamer. MS and cross-linking of eIF2B complexes allows us to propose a model for the subunit arrangements within eIF2B where the subunit assembly occurs through catalytic γ- and ε-subunits, with regulatory subunits arranged in asymmetric trimers associated with the core. Cross-links between eIF2 and eIF2B allow modelling of interactions that contribute to nucleotide exchange and its control by eIF2 phosphorylation. Finally, we identify that GTP binds to eIF2Bγ, prompting us to propose a multi-step mechanism for nucleotide exchange.


Figures

Figure 1
Figure 1. Native MS of yeast eIF2 and eIF2B complexes.
(a) SDS–PAGE (insert) and mass spectrum of the purified yeast His-tagged eIF2 complex showing charge state distributions (labelled with ‘number of charges’ +) for the main species at 4,500–5,500 m/z corresponding to α/β/γ trimer (purple triangles). The α/γ dimer (red diamonds) at 4,000–4,500 m/z and γ at 3,200–3,500 m/z (blue circles) have peak splitting corresponding to a GDP molecule attached. (b) SDS–PAGE (insert) and mass spectrum of the purified yeast FLAG-tagged eIF2B complex showing the main species at 10,000–12,000 m/z corresponding in mass to the double of the eIF2B pentamer (pink star). High-collision energy results in dissociation of the α-subunit (pink circles) at 2,000 m/z and formation of the stripped complexes (14,000–16,000 m/z) where one α-subunit was lost from the eIF2B decamer (pink diamonds). The spectra shown represent an experiment from at least three biological replicates.
Figure 2
Figure 2. MS of eIF2B subcomplexes.
(a) SDS–PAGE (insert) and mass spectrum of the purified yeast four subunit complex lacking the α-subunit eIF2Bβδγε, showing the main species at 9,000–11,000 m/z, corresponding in mass to octameric eIF2Bβδγε (purple diamonds); species at lower m/z correspond to the ε-subunit alone (orange circles at ~\n4,000 m/z) and γε dimer (orange squares at ~\n5,300 m/z). (b) Mass spectrum of the same eight subunit eIF2Bβδγε complex (purple diamonds) as in a after adding 10% ACN, showing appearance of an additional species at 8,000 m/z corresponding in mass to the γ2ε2 tetramer (green diamonds), suggesting its hydrophobic nature. Peaks for the γε dimer (orange squares) and ε-subunit (orange circles) are also increased after disruption with 10% ACN. (c) Mass spectrum of the γε core complex of eIF2B showing charge state distributions for the γε dimer (~\n6,000 m/z, orange squares) and the γ2ε2 tetramer (~\n8,500 m/z, green diamonds). (d) Mass spectrum of the low m/z region of the same spectrum as in c (lower panel) and after incubation with 6-Thio-GTP and ultraviolet cross-linking (upper panel). Separately purified ε-subunit (FLAG-tagged, yellow circles) has been added as a control. Intensities of GTP-bound eIF2Bγ (dark green circles) increase after incubation with 6-Thio-GTP and ultraviolet cross-linking. The spectra shown represent an experiment from two biological replicates.
Figure 3
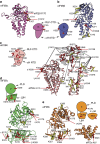
Figure 3. Homology model of yeast eIF2 with identified cross-links.
(a) Homology models for eIF2 α- (grey), β- (cyan) and γ- (blue) subunits were obtained from Swiss Model modelling server and are based on the crystal structure of archaeal aIF2 from S. solfataricus (PDB 3CW2) used as a template. The highly dynamic and flexible nature of eIF2 is apparent from the multiple cross-links observed. Cross-linked lysine residues are shown as coloured spheres, and identified intra- and inter-protein cross-links within eIF2 are shown as orange dashed lines; eIF2α Ser51, involved in regulation, is shown in magenta. (b) Homology models as shown in a. Inter-protein cross-links between eIF2 and eIF2B (red), and inter-protein cross-links between eIF2Bγ K249 and residues around nucleotide-binding site of eIF2 (green). (c) Cartoon representation of eIF2 with mapped inter-cross-linked residues. (d) Crystal structure of the N-terminal part of the eIF2 α-subunit from S. cerevisiae (PDB 1Q46) with identified cross-links and containing Ser51 (labelled as in Fig. 3a). Cross-links shown were obtained from different cross-linking experiments (Supplementary Tables 4 and 5).
Figure 4
Figure 4. Homology model of yeast eIF2B subunits with identified cross-links.
(a) Homology model of the eIF2Bα (res. 1–304) based on the crystal structure of human eIF2Bα (PDB 3ECSA) and cartoon representation of the α-subunit with mapped intra- (yellow) and inter- (red) cross-linked residues. Cross-links are represented by dashed lines: intra, black; inter, red. (b) Homology model of the eIF2Bβ (res. 60–371) based on the crystal structure of human eIF2Bα (PDB 3ECSA) and cartoon representation of the β-subunit with mapped cross-linked residues (labelled as in Fig. 4a). (c) Homology models of the eIF2Bδ: residues 1–244 based on PDB 1YA9A template; residues 245–536 based on PDB 2YVKA template; residues 540–651 based on PDB 3A11A template and cartoon representation of the δ-subunit with mapped cross-linked residues (labelled as in Fig. 4a). (d) Homology models of the eIF2Bγ PL domain (res. 44–314) and LβH (res. 358–578) domains based on PDB 1YP2D and 2OI7A templates, respectively, and cartoon representation the γ-subunit with mapped cross-linked residues (labelled as in Fig. 4a). (e) Homology model of the eIF2Bε (res.30–431) based on PDB 1YP2A; the crystal structure of the catalytic domain ε-cat (res. 524–712) from S. cerevisiae (PDB 1PAQ) and cartoon representation of the ε-subunit with mapped cross-linked residues (labelled as in Fig. 4a). Cross-links shown were obtained from different cross-linking experiments (Supplementary Table 2).
Figure 5
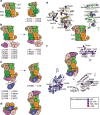
Figure 5. Assembly of eIF2B subunits based on identified cross-links and solvent accessibility.
(a) Schematic representation of the γ2ε2 hydrophobic core showing PL and LβH subunit domain arrangement resembling the arrangement of the AGP homo-tetramer: two copies of γ-subunit are shown in light and dark green, and two copies of ε in orange and beige. LβH domain in the γ-subunit is shown slightly longer than in the ε-subunit (left). Right: cartoon representation of the rotated view of the γ2ε2 hydrophobic core with identified cross-links (red dashed line) between εK176 and γK376, and γK249 (right). (b) Left and right: cartoon representation of the γ2ε2 hydrophobic core and α- and δ-subunits with cross-links (red dashed lines) to the LβH domains of γ and ε. (c) Left and right: cartoon representation of the γ/ε hydrophobic core, α- and δ-subunits and the cross-links of the β-subunit (red dashed lines) to the LβH domains of γ and ε and RLF domain of the δ-subunit. (d) Schematic model of eIF2B decamer shows the tetrameric γ2ε2 core with a regulatory subcomplex of α/β/δ trimers attached to the core through the interaction with ε and γ LβH domains shifted towards ε (right). This shift facilitates interactions of β and δ with the ε PL domain. View from the bottom of the regulatory sub complex α/β/δ is shown (left). (e) Homology models for eIF2Bε and γ subunits are shown and labelled residues are represented as space fillings. The sum of the peptide score obtained for labelled peptides is given in different colours and labelled sites are shown accordingly. Solvent accessibility of protein subunits is indicated in the cartoon representation of eIF2B. (f) Homology models for eIF2Bα, β and δ subunits are shown and labelled residues are represented as in e. Cross-links shown were obtained from different cross-linking experiments (Supplementary Tables 2 and 3).
Figure 6
Figure 6. Interactions between eIF2 and eIF2B identified by cross-links.
(a) Schematic representation of the eIF2 and eIF2B modelled structure with mapped inter-subunit cross-links (red dashed lines); inter-cross-links between residues βK183, βK240 and γ K113 of eIF2, in close proximity to the nucleotide binding pocket, to the eIF2Bγ K249 located in the vicinity of the potential nucleotide binding site (green dashed lines); inter-cross-links of eIF2β (K170 and K247) to either of the two eIF2Bα (K145) and eIF2Bδ (K422) subunits (orange dashed lines). Cross-links shown were obtained from different cross-linking experiments (Supplementary Table 5). (b) Schematic model of eIF2 and eIF2B interactions based on homology modelling and identified cross-links, proposing that GEF function of eIF2B is a multi-step process whereby ε-cat of eIF2B promotes GDP release from eIF2γ (1 and 2) possibly followed by a conformational change (3) allowing transfer of the GTP residing in the nucleotide pocket of eIF2Bγ PL domain (4) and subsequent dissociation of eIF2 (5) after another conformational change induced by GTP binding to eIF2γ. Tighter binding of eIF2 to eIF2B on eIF2α phosphorylation is very likely to interfere with the conformational changes necessary for catalyses abrogating eIF2B function.

Similar articles

Cited by

References

    1. Sonenberg N. & Hinnebusch A. G. Regulation of translation initiation in eukaryotes: mechanisms and biological targets. Cell 136, 731–745 (2009). - PMC - PubMed
    1. Maag D., Fekete C. A., Gryczynski Z. & Lorsch J. R. A conformational change in the eukaryotic translation preinitiation complex and release of eIF1 signal recognition of the start codon. Mol. Cell 17, 265–275 (2005). - PubMed
    1. Singh C. R. et al.. An eIF5/eIF2 complex antagonizes guanine nucleotide exchange by eIF2B during translation initiation. EMBO J. 25, 4537–4546 (2006). - PMC - PubMed
    1. Jennings M. D. & Pavitt G. D. eIF5 has GDI activity necessary for translational control by eIF2 phosphorylation. Nature 465, 378–381 (2010). - PMC - PubMed
    1. Jennings M. D., Zhou Y., Mohammad-Qureshi S. S., Bennett D. & Pavitt G. D. eIF2B promotes eIF5 dissociation from eIF2*GDP to facilitate guanine nucleotide exchange for translation initiation. Genes Dev. 27, 2696–2707 (2013). - PMC - PubMed

Publication types

MeSH terms